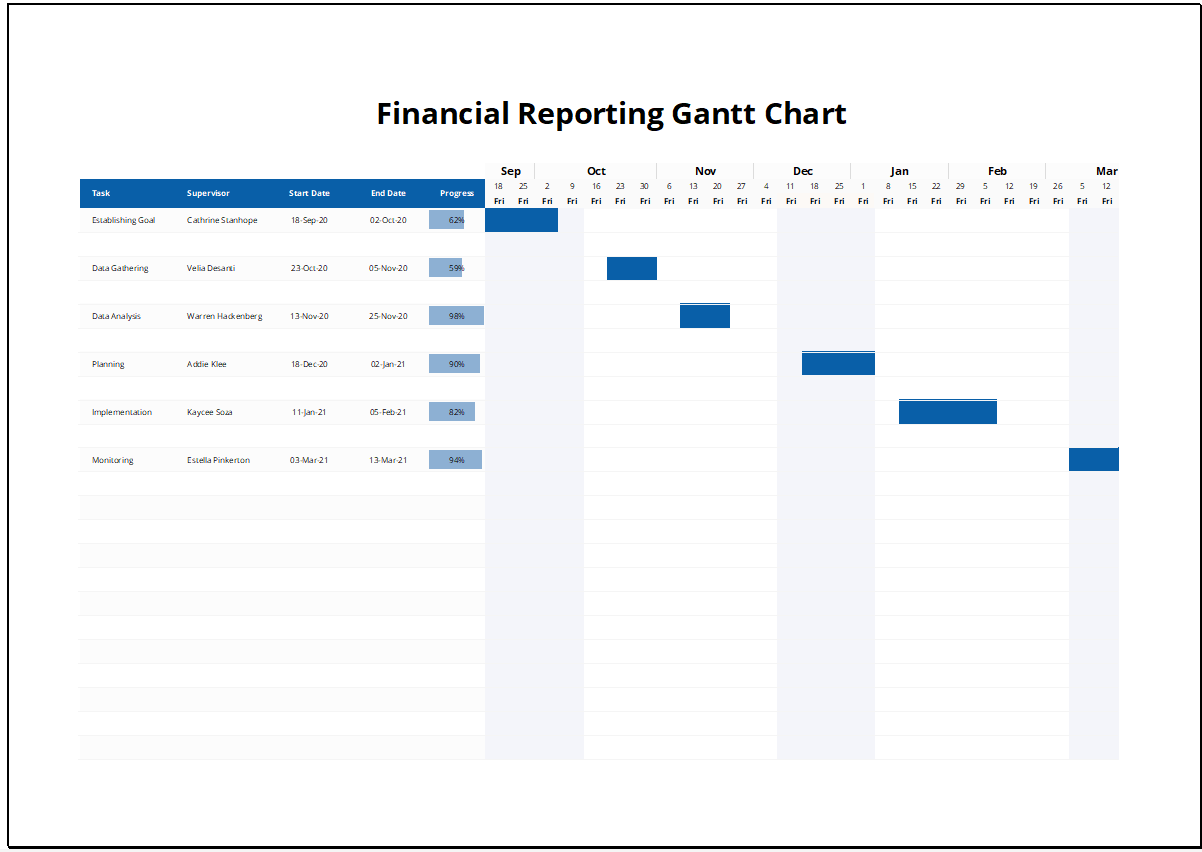
The Financial Reporting Gantt Chart Template is an Excel-based tool designed to help finance professionals plan, schedule, and manage reporting tasks efficiently. From monthly closings to annual reports, this template provides a clear visual timeline of each reporting step. It allows teams to track progress, assign responsibilities, and avoid missed deadlines. Whether you’re working in a small business or a large corporate finance department, this chart improves reporting accuracy and workflow.
Also check out Financial Planning Gantt Chart Excel Template.
It is ideal for financial controllers, accountants, CFOs, and reporting analysts.
Key Features and Functionalities of this template
The template includes a fully editable Gantt chart that adjusts automatically as you update start and end dates. You can enter financial tasks, assign owners, and track completion with built-in percentage fields. Color-coded bars make it easy to see which reports are pending, in progress, or completed.
You can customize the chart to fit different reporting cycles—monthly, quarterly, or yearly. The clean layout is designed to make collaboration easy between finance teams, auditors, and external stakeholders. Use it to organize every step of your financial reporting process in one place.
Use Cases of Gantt Chart in Financial Reporting
The Financial Reporting Gantt Chart supports a wide range of reporting workflows, including:
- Month-end closing: Track journal entries, reconciliations, and financial statements.
- Quarterly reviews: Schedule data analysis, variance reviews, and board presentations.
- Annual reports: Plan audits, final reports, and external disclosures.
- Compliance reporting: Organize tax filings, regulatory submissions, and certifications.
- Investor updates: Set timelines for preparing shareholder reports and financial snapshots.
- Forecast and budgeting tie-ins: Align reporting timelines with budgeting cycles and forecasts.
- Consolidated reporting: Coordinate reporting tasks across business units or subsidiaries.
This template suits businesses, accounting firms, financial consultants, and anyone responsible for delivering timely and accurate financial reports.
Download this Gantt Chart Template
The Financial Reporting Gantt Chart Template brings clarity to your reporting process. It helps reduce bottlenecks, increase accountability, and improve deadline management. With an intuitive Excel interface, this tool offers both flexibility and control.
Download now and streamline your financial reporting with this professional Excel Gantt chart.