Visualize Sales Forecasting Activities with Structured Timelines
Accurate forecasting is the backbone of revenue planning and strategic decision-making. The Sales Forecasting Gantt Chart Template is a powerful Excel-based tool designed to help sales leaders, analysts, and business managers track forecasting tasks, align timelines, and monitor progress over defined periods. It brings visibility to every stage of the forecasting process—ensuring that key inputs, team updates, and projections are aligned and delivered on time.
This template is ideal for quarterly planning, annual budgeting, or project-specific revenue forecasting activities.
Why This Template Supports Strategic Sales Forecasting
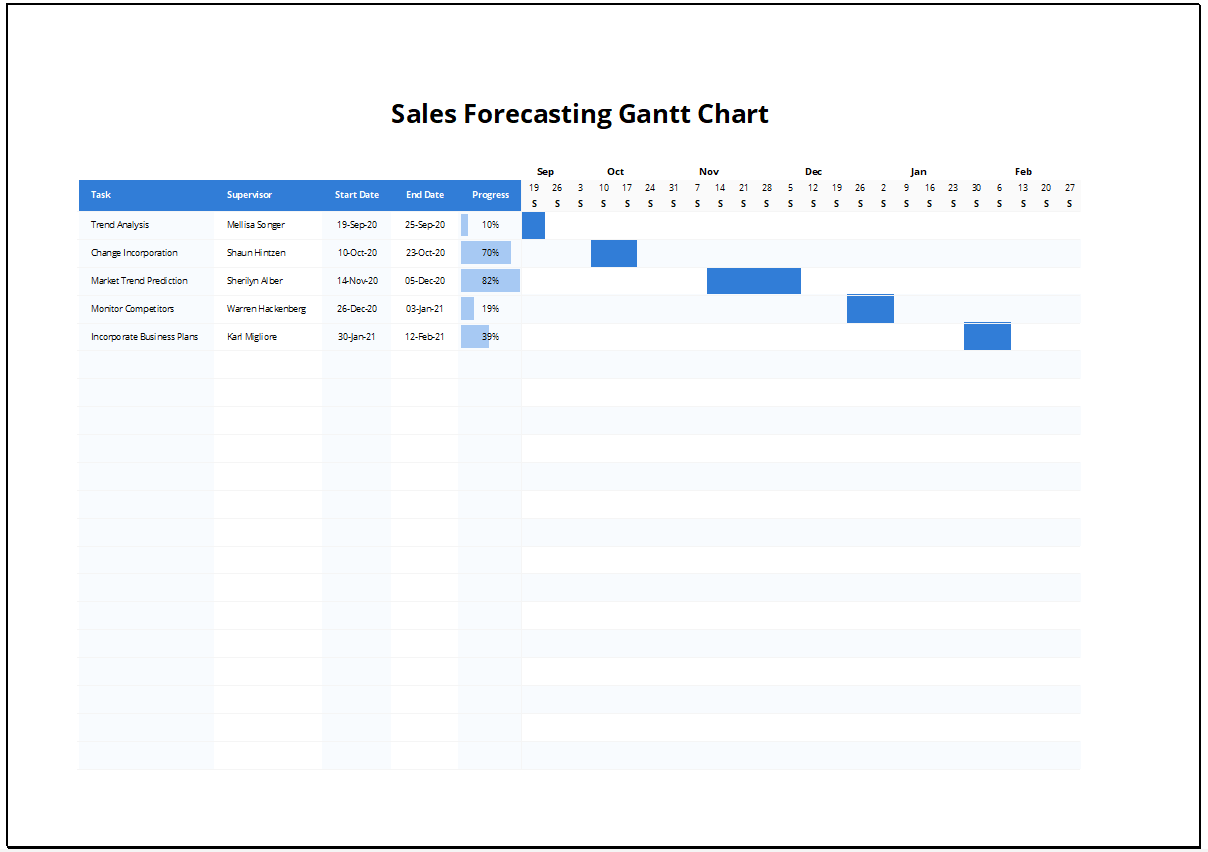
The Excel Gantt chart allows you to break the forecasting process into key stages such as data collection, analysis, review, and reporting. Each task appears as a color-coded bar on a timeline, with editable start and end dates and real-time progress tracking. It enables teams to collaborate across departments while maintaining one centralized view of forecasting progress.
Using this template, you can:
- Plan data gathering, model building, scenario analysis, and review sessions
- Assign forecasting responsibilities across finance, sales, and operations
- Monitor task completion using built-in percentage trackers
- Prevent delays in financial reporting or budget finalization
- Align forecasting deliverables with executive review and board meetings
It helps teams meet forecasting deadlines and improves the reliability of sales insights.
Use Cases for Revenue Planning and Forecast Management
The Sales Forecasting Gantt Chart Template is useful for organizations of all sizes and industries. Some practical applications include:
- Enterprise sales teams: Track regional forecasts, quota planning, and quarterly projections
- Finance departments: Align sales input with budgeting, scenario modeling, and investor reports
- Retail and e-commerce: Coordinate seasonal sales predictions and inventory planning
- Startups and SaaS companies: Structure ARR/MRR forecasting, pipeline analysis, and board updates
- Consulting firms: Plan client-specific forecasting engagements with deliverables and checkpoints
- Manufacturing and distribution: Predict demand, manage supply timelines, and avoid stockouts
It brings structure and accountability to a process that often requires cross-functional collaboration.
Download and Improve Your Forecasting Process
The Sales Forecasting Gantt Chart Template enables teams to organize forecasting activities with discipline and clarity. It improves collaboration, reduces reporting errors, and enhances executive confidence in revenue projections.
Download now and plan your sales forecasts with this structured, Excel-based Gantt chart.
Need more templates? Visit our full Gantt Chart Template Collection for Excel tools that support planning, reporting, resource allocation, and more.