Plan, Track, and Manage Analysis Projects with a Visual Timeline
Running a thorough sample analysis project requires organized phases—from sample collection and testing to data analysis and final reporting. The Sample Analysis Gantt Chart Template is an Excel-based tool designed to help scientists, analysts, and research teams structure their work over a clear, visual timeline. It makes complex analytical workflows easier to manage by ensuring that every phase is scheduled, assigned, and tracked.
Perfect for laboratory environments, research institutes, quality control teams, and academic researchers, this template ensures timelines are met without compromising accuracy.
Why This Template Simplifies Analysis Project Management
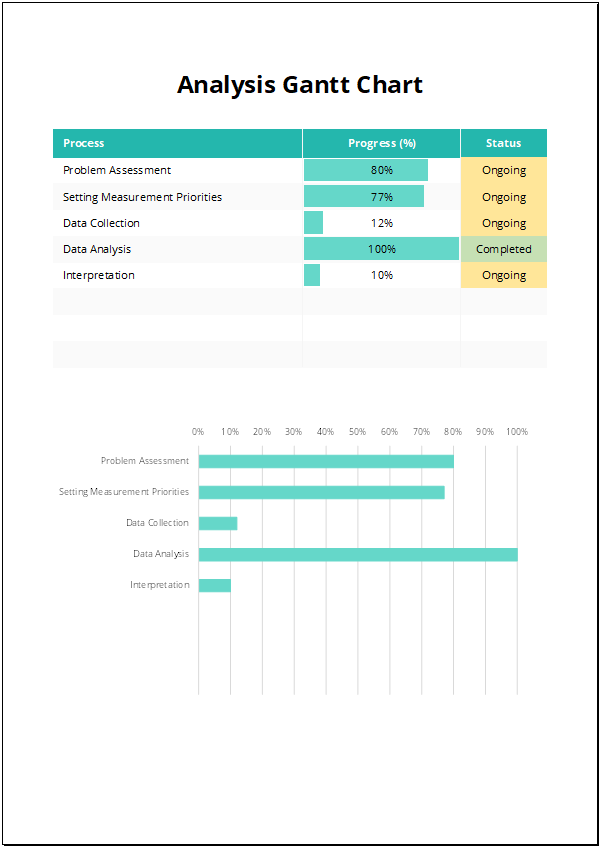
This Excel Gantt chart organizes each stage of your sample analysis project into a color-coded, time-based timeline. You can input tasks such as collection, preparation, testing, verification, and reporting, and the chart updates automatically based on assigned dates. Built-in progress tracking helps monitor task completion in real time, ensuring smooth execution across all stages.
With this template, you can:
- Schedule key activities across data collection, laboratory testing, and result interpretation
- Assign responsibilities to technicians, researchers, or data analysts
- Track progress and deadlines visually for better project control
- Manage multiple sample batches or analysis types simultaneously
- Report project status easily to supervisors, clients, or regulatory bodies
It eliminates the guesswork and improves coordination among scientific and research teams.
Use Cases Across Research, Lab Work, and Quality Control
The Sample Analysis Gantt Chart Template is adaptable across different types of research and analysis initiatives. Real-world examples include:
- Scientific laboratory projects: Plan timelines for sample collection, preparation, testing, and reporting
- Pharmaceutical research: Manage analysis phases for clinical or pre-clinical trial samples
- Food and beverage quality control: Track testing and certification for safety and compliance
- Environmental research: Organize sampling, testing, and reporting for field studies
- Academic research projects: Plan student or faculty research involving multi-phase analysis
- Industrial process testing: Structure timelines for R&D sample validation or product testing
It’s a valuable planning tool wherever precise scheduling and tracking of analysis activities are critical.
Download and Streamline Your Sample Analysis Projects
The Sample Analysis Gantt Chart Template helps you structure complex analytical projects with confidence and efficiency. It provides a centralized view of your tasks, helping teams stay organized, meet deadlines, and maintain quality throughout the project.
Download now and manage your sample analysis workflows with this easy-to-use Excel Gantt chart.
Looking for more project organization tools? Visit our complete Gantt Chart Template Collection for templates built for planning, analysis, marketing, HR, and project delivery.