Visualize Analysis Projects from Start to Finish with a Timeline That Works
Analytical projects often require careful coordination between data collection, evaluation, reporting, and review. The Simple Analysis Gantt Chart Template provides an easy-to-use Excel-based format that allows teams and professionals to organize their analysis tasks visually over a clear timeline. As a result, you can structure your project better, monitor each phase, and ensure nothing falls through the cracks.
This template is ideal for researchers, analysts, consultants, academic teams, and internal departments managing routine or complex analyses.
Why This Template Makes Analysis Projects Easier
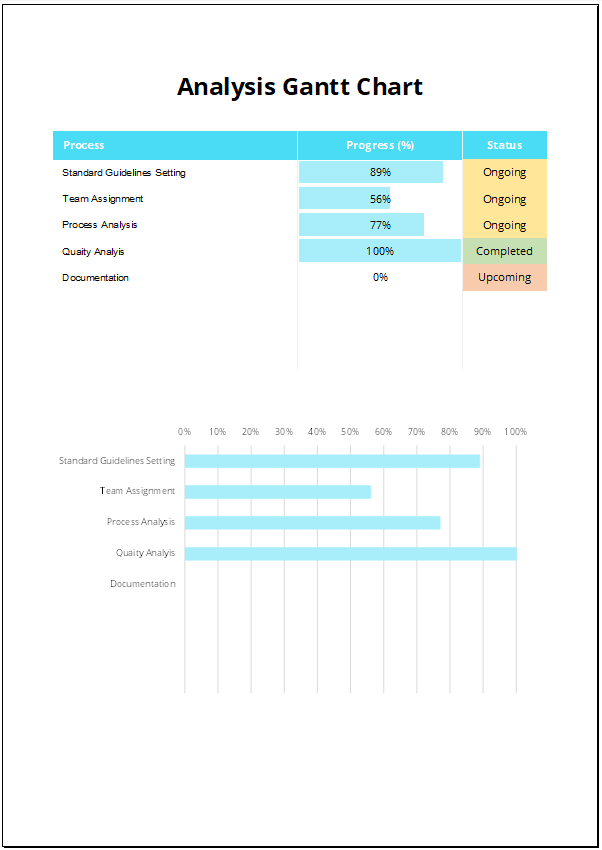
With its intuitive layout, this Gantt chart presents every analytical task as a color-coded timeline bar, helping you track task durations and dependencies effectively. In addition, it includes built-in fields for updating progress percentages, which helps monitor your project’s real-time status.
Using this template, you can:
- Break complex analysis into manageable steps
- Assign task ownership for better collaboration
- Schedule data gathering, processing, review, and delivery
- Identify delays early and reallocate resources accordingly
- Present your timeline clearly during team or client meetings
Moreover, it eliminates the need for complex project management software by leveraging Excel’s simplicity.
Who Can Use the Simple Analysis Gantt Chart
The Simple Analysis Gantt Chart Template is useful for individuals and teams across industries and academic domains. Common use cases include:
- Business analysts: Plan market analysis, operational evaluations, and performance reviews
- Consulting teams: Track client deliverables, insights generation, and final presentations
- Research professionals: Schedule data collection, experiment timelines, and paper submissions
- Academic teams: Organize student research timelines, thesis work, and evaluations
- Product teams: Coordinate product analytics, customer feedback analysis, and KPI reporting
- Finance departments: Structure risk assessments, audit preparation, and financial modeling
In short, anyone who needs to manage an analytical workflow will find this template useful.
Key Benefits of Visual Planning for Analysis Tasks
Working without a clear schedule can lead to missed deadlines, poor coordination, and inconsistent results. By using this template, you can:
- Clarify timelines and dependencies across stakeholders
- Improve accountability by assigning responsibility to each step
- Streamline project updates with clear visual cues
- Track analysis cycles over days, weeks, or months
- Optimize output quality by keeping every task aligned
Therefore, this Gantt chart template becomes a central tool in any analysis-driven environment.
Download and Take Control of Your Analytical Projects
The Simple Analysis Gantt Chart Template enables you to plan and execute data-driven projects with structure and confidence. Its simplicity, combined with Excel’s accessibility, makes it a practical solution for professionals managing timelines, resources, and deliverables.
Download now and simplify your analytical planning with this easy-to-edit Excel Gantt chart.
Looking for more resources? Visit our full Gantt Chart Template Collection for Excel templates across operations, research, finance, HR, and marketing.