Analyze Sales Performance and Profitability with Clarity
The Net Sales and Profit Breakdown Excel Template is a professional tool designed to give businesses a granular view of revenue generation and bottom-line performance. It provides a detailed breakdown of gross sales, deductions, net revenue, and profit margins—perfect for decision-makers who need precise financial visibility.
Whether you’re reviewing product-level profitability, evaluating discounts and returns, or summarizing financial performance for a report, this template helps simplify complex calculations into an easy-to-interpret layout.
Organized for Sales and Profit Transparency
This spreadsheet is structured into logical sections, helping you move from gross sales inputs to final profit insights:
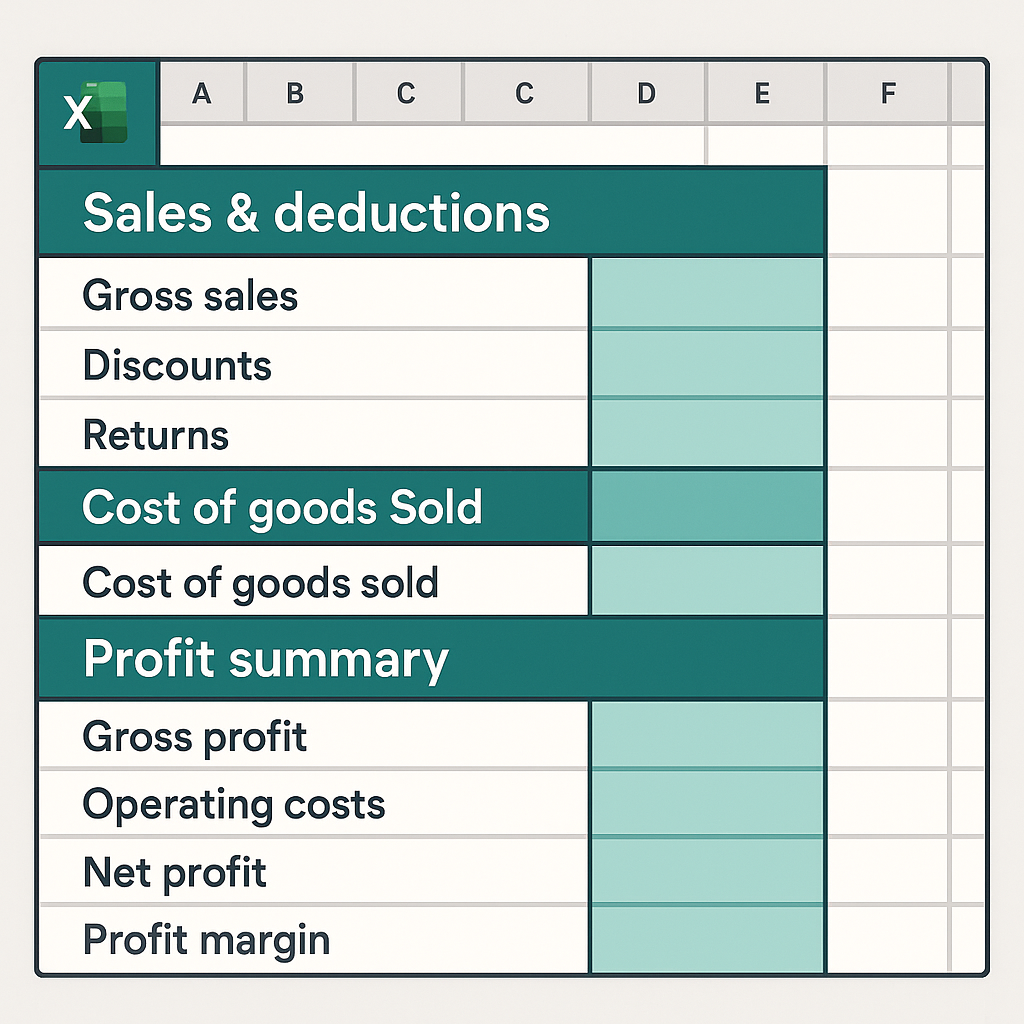
Sales & Deductions Section
Track revenue flows with fields such as:
- Gross sales
- Discounts
- Returns
- Net sales after deductions
These calculations allow teams to understand the true revenue impact of price adjustments or customer refunds.
Cost of Goods Sold (COGS)
Input direct costs associated with the production or purchase of goods sold. The sheet then subtracts COGS from Net Sales to calculate Gross Profit.
Operating Expenses & Net Profit Calculation
Record overhead or recurring expenses such as rent, salaries, or marketing. The final section summarizes:
- Gross Profit
- Total Operating Costs
- Net Profit
- Profit Margin (calculated as % of Net Sales)
This end-to-end breakdown highlights operational efficiency and identifies areas for margin improvement.
Chart-Ready Format
The data layout supports chart creation for visual reports. Conditional formatting can be added to highlight profitability dips or thresholds.
Best For Financial Reporting and Business Reviews
This Excel template is highly useful for:
- Business owners reviewing monthly or quarterly sales health
- Accountants and controllers preparing P&L summaries
- Retailers analyzing profitability by product or region
- Consultants benchmarking client financials
- Sales analysts connecting top-line and bottom-line trends
It supports multi-period use and can be easily expanded to include multiple departments, SKUs, or timeframes.
Why Excel Works for Profitability Analysis
While accounting software tracks detailed ledgers, Excel remains unmatched for fast, flexible analysis. This template allows you to run calculations, test pricing assumptions, and summarize reports without relying on ERP exports or finance systems.
It’s printable, shareable, and presentation-ready—perfect for internal reviews, board meetings, or investor updates.
The Net Sales and Profit Breakdown Template ensures you know not just how much you’re selling—but how much you’re really keeping.
Explore More Excel Tools for Revenue Management
This financial template is part of our wider collection of practical Excel tools for sales, planning, and performance reporting. Browse our full Sales Related Excel Templates to access more calculators, trackers, and revenue planners.