Visualize Progress Toward Sales Goals with a Dynamic Thermometer
The Sales and Revenue Thermometer Chart Excel Template is a visual performance dashboard designed to track revenue against sales targets. Using a bold thermometer-style chart, this template helps teams and business leaders quickly see how close they are to hitting key milestones—making it perfect for monthly targets, annual revenue goals, or fundraising updates.
Whether displayed on a team dashboard, shared in a weekly meeting, or sent to stakeholders, this Excel template offers an engaging, visual way to keep goals front and center.
Structured to Show Progress at a Glance
The template features one main dashboard sheet with both data inputs and a dynamic thermometer chart:
Sales Target Input Section
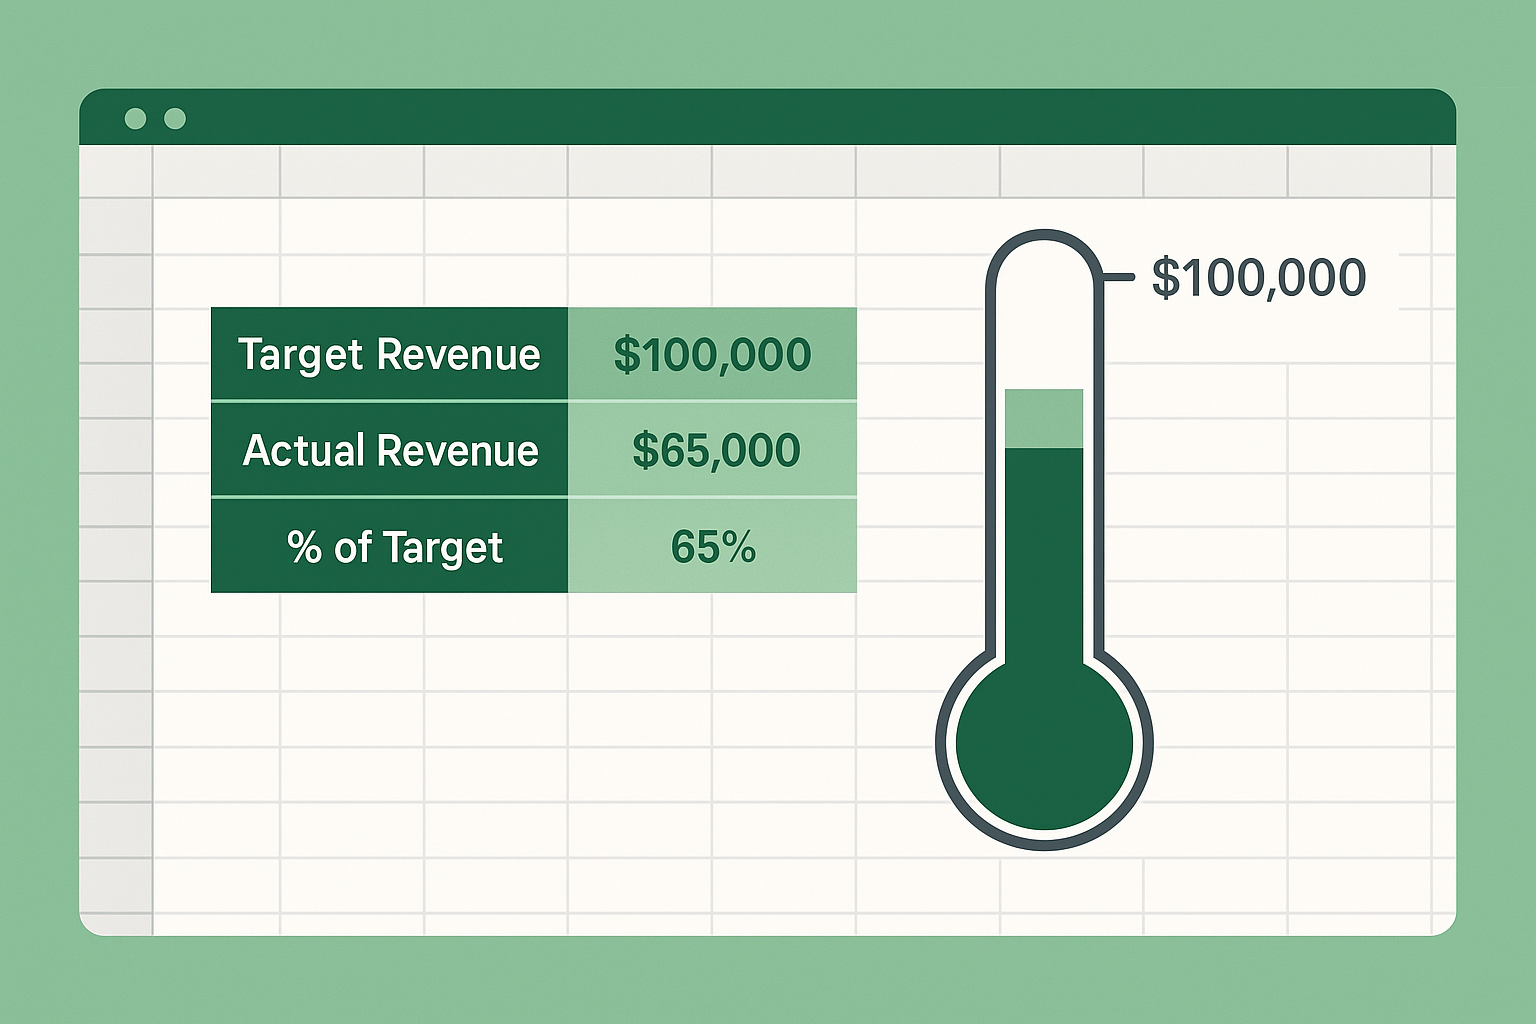
Begin by entering your target revenue and actual sales to date. The thermometer will automatically reflect progress in real-time as the actual sales number increases.
Fields include:
- Target revenue
- Actual revenue
- % completion (auto-calculated)
Thermometer Chart Visualization
The main visual—a vertical bar that fills up like a thermometer—rises as actual revenue increases. The chart is:
- Color-coded for impact
- Proportional to your input values
- Easy to present in meetings or reports
Optional Customizations
You can modify:
- Color themes (e.g., green, red, blue for different campaigns)
- Labels and currency symbols
- Target units (can be product quantity, donations, or revenue)
This flexibility makes the template usable for any sales-driven or goal-driven initiative.
Best For Sales Motivation and Stakeholder Updates
This chart template is ideal for:
- Sales teams tracking monthly or quarterly targets
- Fundraising campaigns showing real-time donations
- Executive teams sharing revenue progress in board reports
- Retail stores or reps visualizing sales contests or bonuses
- Marketing campaigns tracking lead or signup targets
It’s especially effective when displayed on office monitors or sent out in weekly performance emails.
Why Excel Is Perfect for Visual Sales Dashboards
While BI tools and CRMs offer performance dashboards, Excel remains a favorite for lightweight, quick-turn visualizations that are easy to update, duplicate, and share.
This Thermometer Chart Template works offline, doesn’t require integration, and can be customized for any team or timeframe. You control the format, logic, and design—and you can always copy/paste the chart into PowerPoint or email reports.
With the Sales Thermometer Excel Template, progress tracking becomes visual, motivational, and actionable.
Explore More Templates for Sales Reporting and Visibility
This thermometer-style sales tracker is part of our broader library of tools for revenue planning, activity tracking, and forecasting. Visit our Sales Related Excel Templates to explore more practical spreadsheets built for high-performance sales teams.