Visualize Project and Task Status with Color-Coded Alerts
Monitoring progress across multiple tasks, departments, or milestones can quickly become complex. The Status Reporting Template with traffic light indicators brings clarity and instant visibility to your reports. Built in Excel, this template uses intuitive color codes—green, yellow, and red—to signal the health or status of each item, making it ideal for project managers, team leads, and operations coordinators.
Whether you’re reporting weekly updates or overseeing daily check-ins, this visual tool helps communicate progress quickly and clearly.
What’s Inside – Understanding the Traffic Lights Worksheet
The workbook features a single, powerful worksheet titled “Traffic Lights”, and it is designed to consolidate key information and convert it into a color-coded status board:
Worksheet Structure & Functionality
- Task or Item Listing:
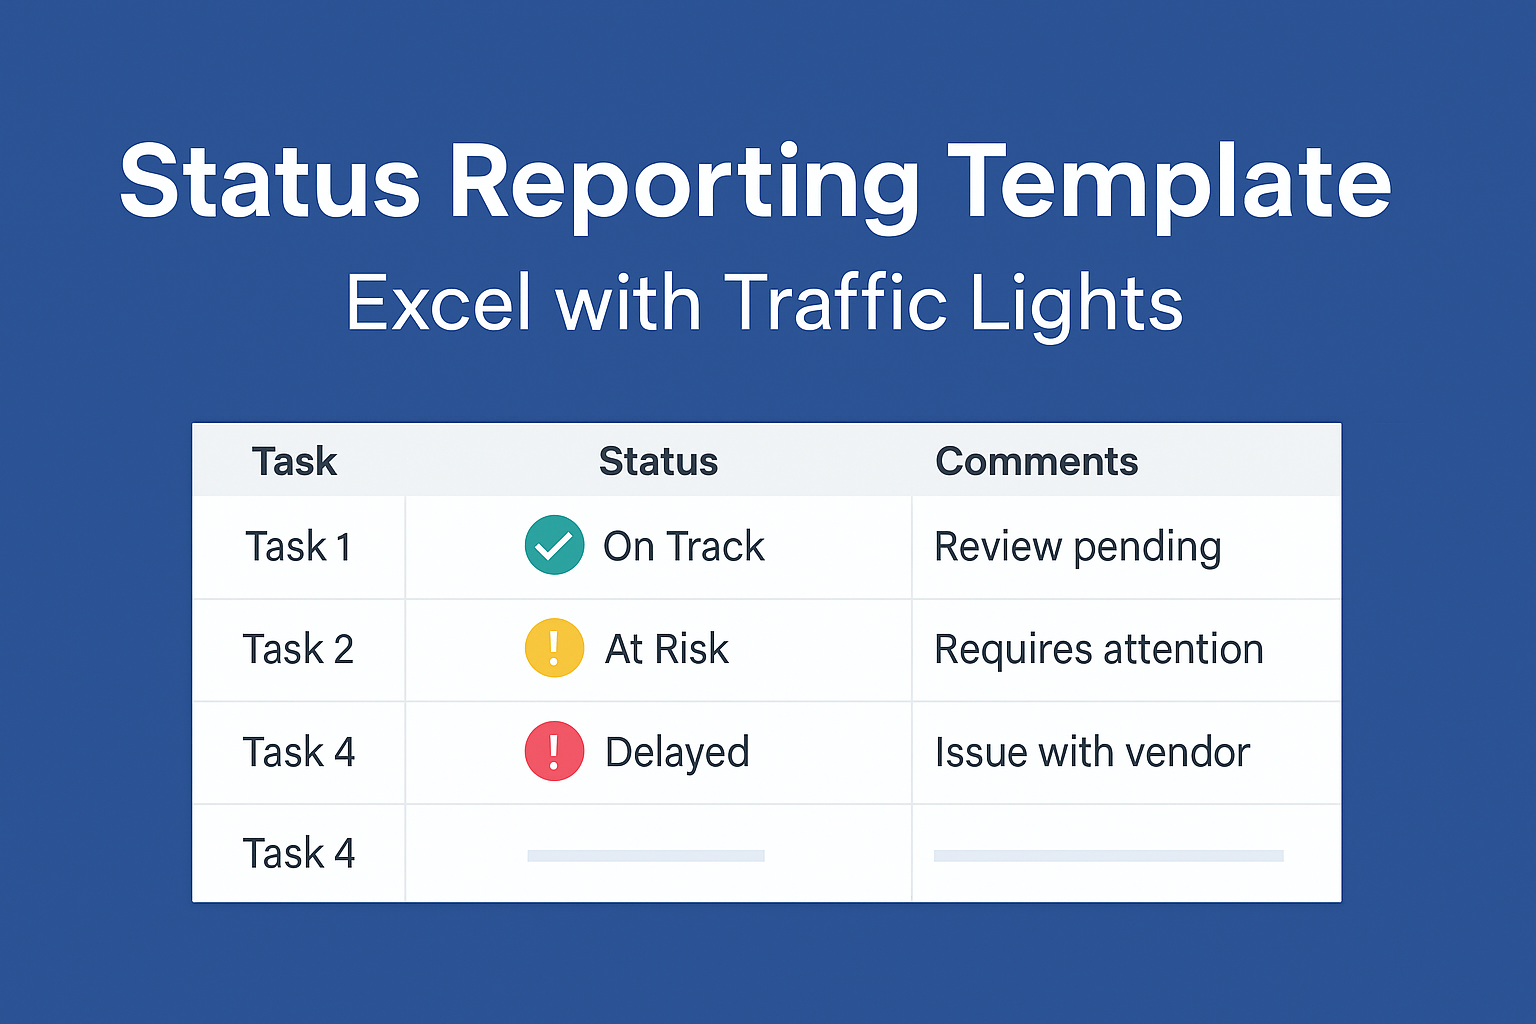
Each row represents a task, project component, operational area, or key deliverable. Users can rename or relabel these based on their organizational context—making the template highly flexible. - Status Columns:
Status indicators are placed alongside each task. These are conditionally formatted using Excel rules to automatically change color based on the value selected (e.g., “On Track”, “At Risk”, “Delayed”). The result is a dynamic status board with red (⚠️), yellow (⚠️), and green (✅) cells that provide immediate visual feedback. - Comments or Notes:
Additional columns allow users to provide context, responsible owners, or action steps. This keeps the template functional not just for display, but also for decision-making and follow-up. - Automated Highlights:
Through Excel’s built-in conditional formatting, users don’t need to manually color each cell. As the status label changes, the color changes instantly—saving time and reducing errors.
This makes it an excellent tool for both individual reporting and team-level dashboards.
Use Cases for Teams, Projects, and Business Operations
The Status Reporting Template is useful across multiple business scenarios:
- Project managers: Track status across milestones, deliverables, and risks
- Operations teams: Monitor departmental KPIs and issue tracking
- Client service teams: Report weekly updates to clients in a visually simple format
- IT teams: Monitor system statuses, deployment checkpoints, or testing progress
- Agile sprints: Flag user stories or tasks that are blocked, progressing, or complete
- Leadership reporting: Provide executives with a one-glance summary of business performance
Its minimal structure ensures ease of use, while its visual impact increases stakeholder engagement.
Why Use a Traffic Light Status Template
Compared to text-heavy reports, this template:
- Enables faster understanding of complex updates
- Reduces reporting fatigue with visual cues
- Improves consistency across teams or departments
- Simplifies weekly or daily status reviews
- Encourages proactive issue resolution by highlighting risks early
Therefore, it transforms communication from cluttered to clear—without needing any additional software.
Download and Visualize Your Project Status Clearly
The Status Reporting Template using traffic light indicators is a simple yet powerful way to communicate progress, risk, and accountability. Built entirely in Excel, it’s easy to adapt and ready for daily use in any business setting.
Download now and bring visibility and consistency to your reporting with color-coded clarity.
Explore more Excel productivity tools in our Template Library for dashboards, trackers, and project management.