Visualize Sprint Progress with a Simple, Effective Burndown Chart in Excel
The Basic Burndown Chart Template is a streamlined Excel tool built to help agile teams monitor sprint performance and track remaining effort over time. It’s perfect for Scrum Masters, Product Owners, and Project Managers who need a fast, accurate way to visualize whether their team is on track to complete the sprint workload.
Rather than relying on complex tools or integrations, this template offers a lightweight, no-code solution that gives you full visibility into task completion across any sprint length. It’s ideal for daily standups, sprint retrospectives, or performance reviews—enabling informed decisions based on actual delivery trends.
What’s Inside: A Clean Layout Focused on Agile Efficiency
This template contains a single, purpose-built worksheet that automatically updates a line chart based on your sprint input data. Key fields and features include:
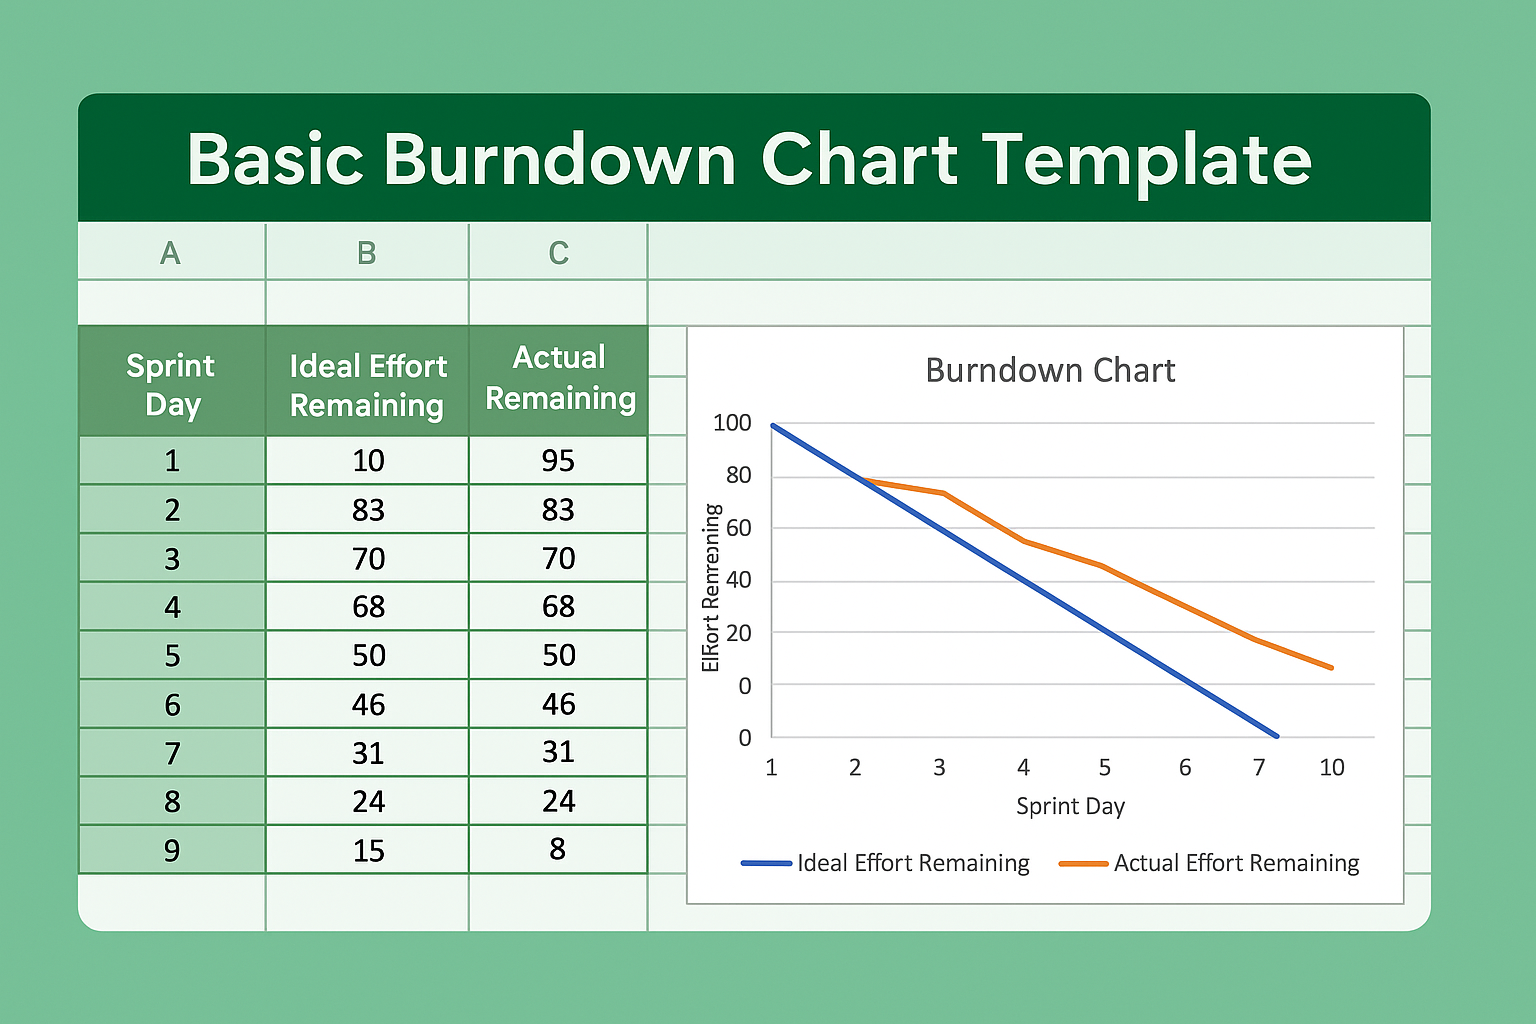
- Sprint Days: A row to input each working day of the sprint (e.g., Day 1 to Day 10).
- Ideal Effort Remaining: Automatically calculated to represent a straight-line progression from full effort to zero, reflecting ideal team velocity.
- Actual Effort Remaining: Enter daily updates based on how many story points or tasks remain at the end of each day.
- Dynamic Burndown Chart: A two-line visual showing the ideal vs. actual effort. The chart updates in real time as you log progress.
The simplicity of the layout makes it easy for team members to update and for managers to interpret. The focus is on clarity: no clutter, no unnecessary metrics—just the essential view of whether your sprint is on track.
Who Should Use This Burndown Chart?
This Excel template is best suited for:
- Agile Teams wanting an offline, easy-to-share way to track sprint progress.
- Scrum Masters who need a chart to use during daily standups or retrospectives.
- Project Leads reporting on task delivery without needing full project management suites.
- Freelancers or Consultants looking for a minimal but effective way to communicate timelines with clients.
- Agile Beginners who want to learn the value of tracking story completion with a low-tech tool.
Even advanced teams can benefit from this template when working on isolated projects, cross-functional teams, or when dealing with restricted access to cloud-based agile platforms.
Why Use This Template Instead of Other Tools?
Unlike Jira or other agile platforms that require setup, user accounts, and integrations, this Excel-based template works immediately and offline. You don’t need to configure charts or calculate formulas—it’s all built-in. Just update your effort numbers each day and the chart takes care of the rest.
Because the burndown chart is built in Excel, you can easily customize it: add conditional formatting, create additional sprints on new sheets, or layer in annotations. It’s your data, your layout, and your control—without software overhead.
This is also an excellent teaching tool for teams new to agile or for stakeholders who need a visual explanation of sprint tracking without technical barriers.
Discover More Tools to Simplify Agile Reporting
The Basic Burndown Chart Template is part of a broader library of Excel resources designed to make agile workflows easier to manage. From full-featured sprint dashboards to status reports and release plans, our tools help you stay agile without adding complexity.
Visit our full collection of Project Management Related Excel Templates to explore practical, easy-to-use spreadsheets for every stage of the agile lifecycle.