pub » Page 8 of 70 » excelguru.io

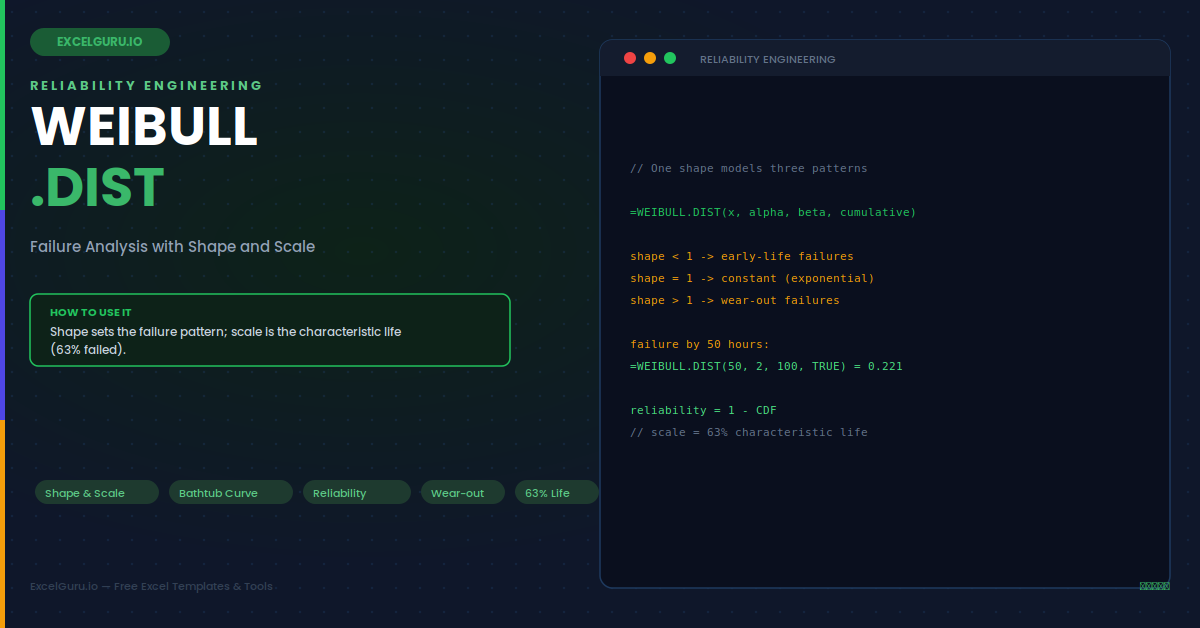
WEIBULL.DIST function in Excel tutorial for reliability analysis failure probability forecasting characteristic life and bathtub curve

WEIBULL.DIST: Reliability Analysis & Failure Forecasting

Master the WEIBULL.DIST function in Excel for reliability analysis and failure forecasting. This tutorial explains how the Weibull distribution uses shape and scale parameters to model early-life failures, random failures, and wear-out patterns. Learn how to calculate failure probabilities, survival and reliability values, characteristic life, and failure trends using practical Excel examples. The guide also explains the Weibull bathtub curve, cumulative versus probability density calculations, common errors, and how Weibull compares with the exponential distribution. Ideal for reliability engineers, analysts, quality-control professionals, researchers, statisticians, and Excel users working with product lifetimes and maintenance data.
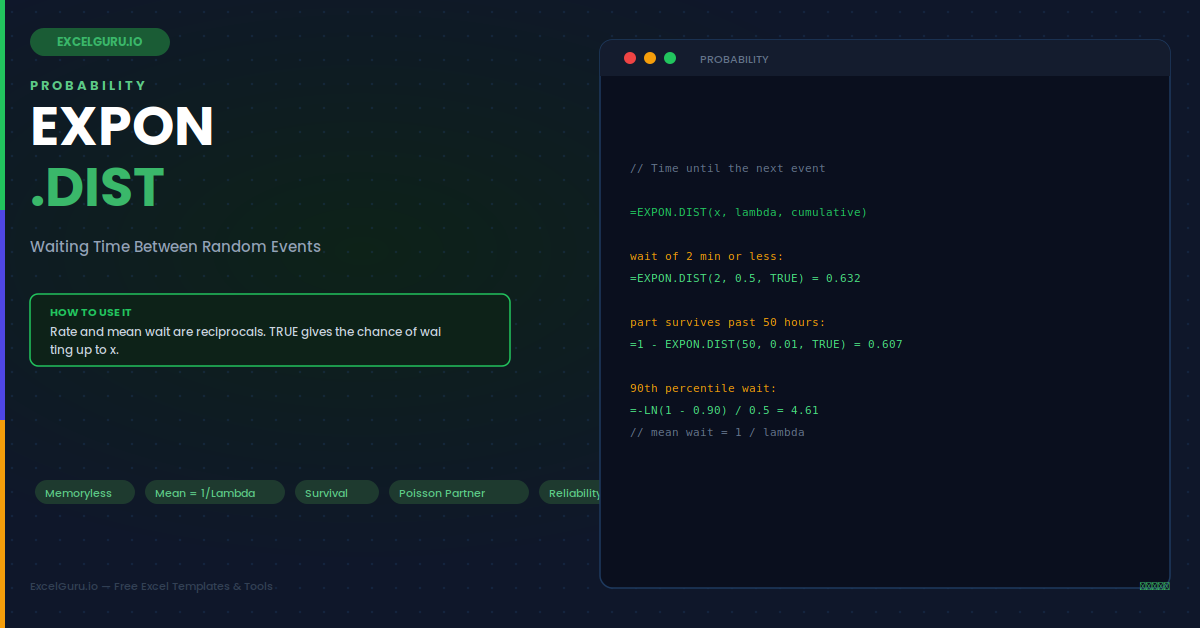

EXPON.DIST function in Excel tutorial showing exponential distribution waiting time probability reliability and time-to-failure analysis

EXPON.DIST: Exponential Distribution for Time‑Between‑Events Analysis

Learn how to use the EXPON.DIST function in Excel to model the time between random events occurring at a steady average rate. This practical tutorial explains the function syntax, rate parameter, cumulative versus probability density calculations, and the relationship between exponential and Poisson distributions. Explore worked examples for customer arrivals, waiting times, reliability, time-to-failure, survival probabilities, percentiles, and service-level targets. You’ll also learn about the exponential distribution’s memoryless property, common errors, and when a Weibull distribution may be more appropriate. Ideal for students, analysts, statisticians, researchers, engineers, and Excel users working with probability, forecasting, and reliability analysis.

50/30/20 Budget Planner Excel Template for tracking needs wants savings income expenses and monthly budget goals

Simple 50-30-20 Budget Planner

Take control of your money with this free 50/30/20 Budget Planner Excel Template. Organize your monthly income and expenses using the popular 50/30/20 budgeting method, allocating 50% to needs, 30% to wants, and 20% to savings and financial goals. Track spending by category, compare actual expenses with your targets, monitor savings progress, and identify areas where you can reduce unnecessary spending. Ideal for individuals, students, families, professionals, and anyone looking for a simple Excel-based approach to budgeting and better money management.

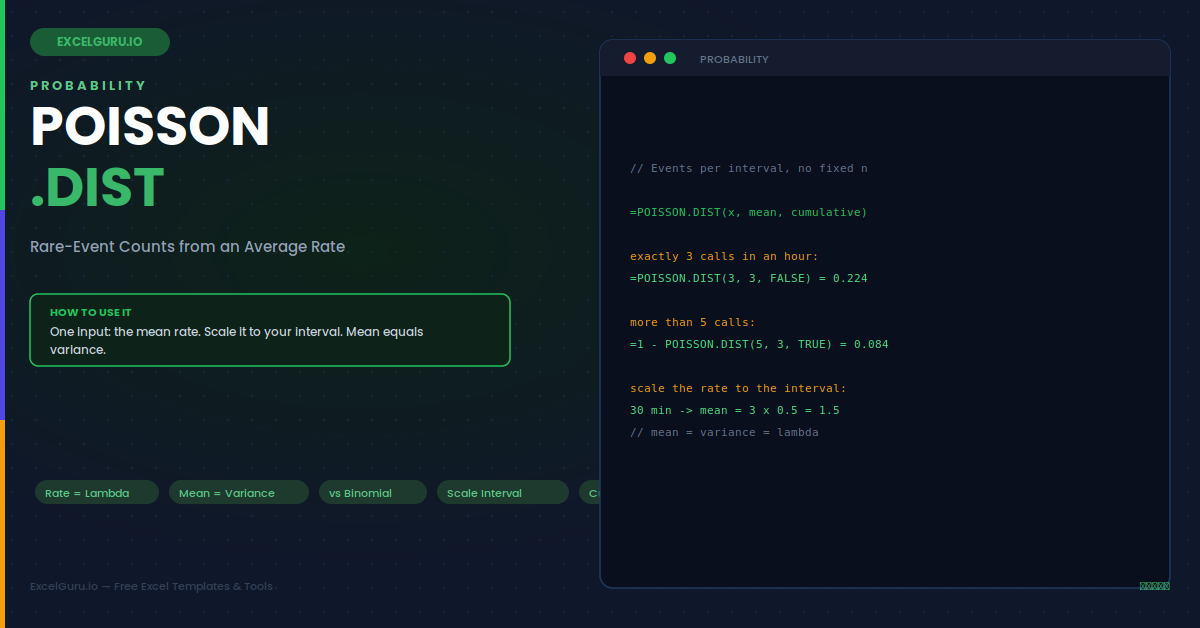
POISSON.DIST function in Excel tutorial showing Poisson distribution probability calculations rare events mean rates and statistical analysis

POISSON.DIST: Poisson Distribution for Rare Event Predictions

Master the POISSON.DIST function in Excel to calculate the probability of rare events occurring within a specific time, distance, or area. This tutorial explains the POISSON.DIST syntax, mean event rate, exact versus cumulative probabilities, interval-based rate adjustments, practical examples, and common errors. Learn how to calculate probabilities for calls per hour, production defects, accidents, website errors, and other count-based events, and understand when the Poisson distribution is more appropriate than the binomial distribution. Ideal for students, analysts, statisticians, researchers, quality-control professionals, and Excel users working with probability and forecasting.

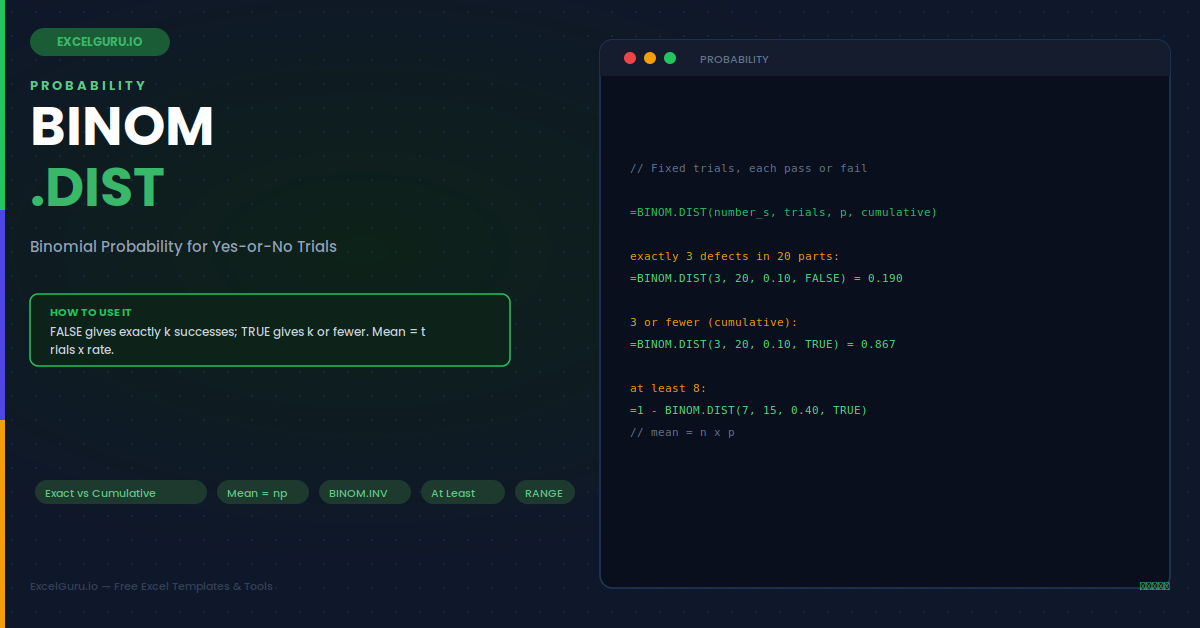
BINOM.DIST function in Excel tutorial showing binomial distribution probability calculations trials success rates and statistical analysis

BINOM.DIST: Binomial Probability Distribution Made Easy

Master the BINOM.DIST function in Excel to calculate probabilities for a fixed number of independent trials with two possible outcomes, such as success or failure. This tutorial explains the BINOM.DIST syntax, number of trials, probability of success, exact versus cumulative probabilities, practical examples, and common errors. You’ll also learn how to apply binomial distribution to quality control, sales forecasting, survey analysis, risk assessment, and other real-world probability problems. Ideal for students, analysts, statisticians, researchers, finance professionals, and Excel users working with probability and statistical models.

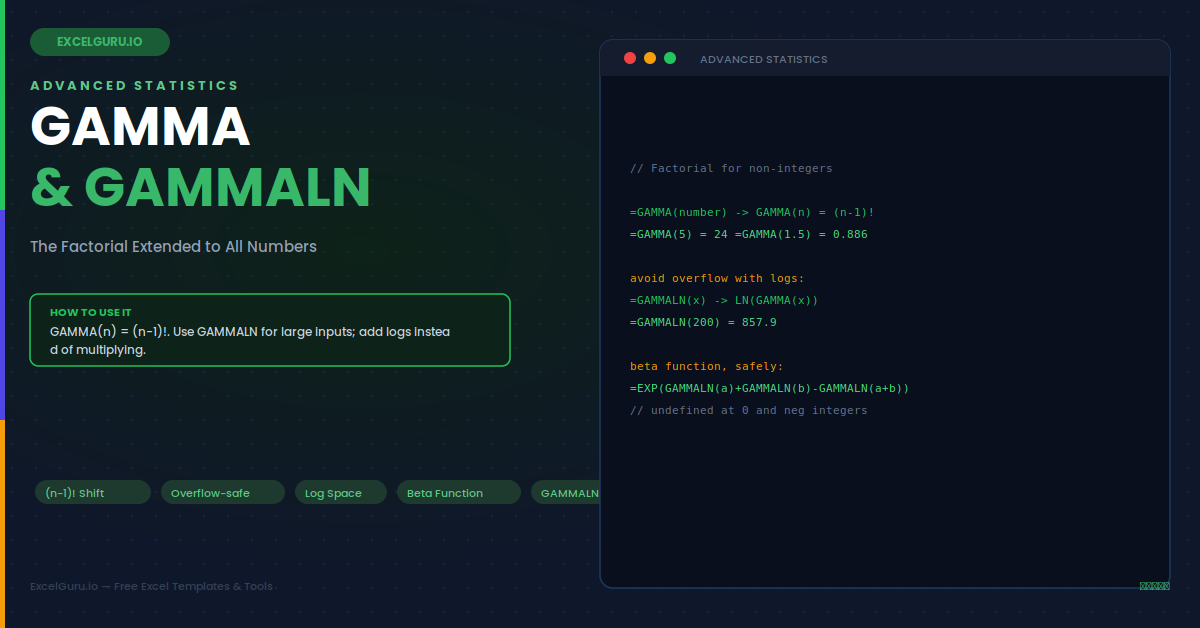
GAMMA and GAMMALN functions in Excel tutorial showing gamma function logarithmic gamma calculations statistical analysis and mathematical modelling

GAMMA & GAMMALN: Advanced Statistical Functions in Excel

Explore the GAMMA and GAMMALN functions in Excel for advanced statistical and mathematical calculations. This tutorial explains how GAMMA calculates the gamma function and how GAMMALN returns the natural logarithm of the gamma function, along with syntax, practical examples, and common errors. You’ll also learn how these functions relate to factorials, probability distributions, statistical modelling, and numerical calculations. Ideal for students, statisticians, researchers, engineers, analysts, and advanced Excel users working with probability, mathematical models, and quantitative analysis.

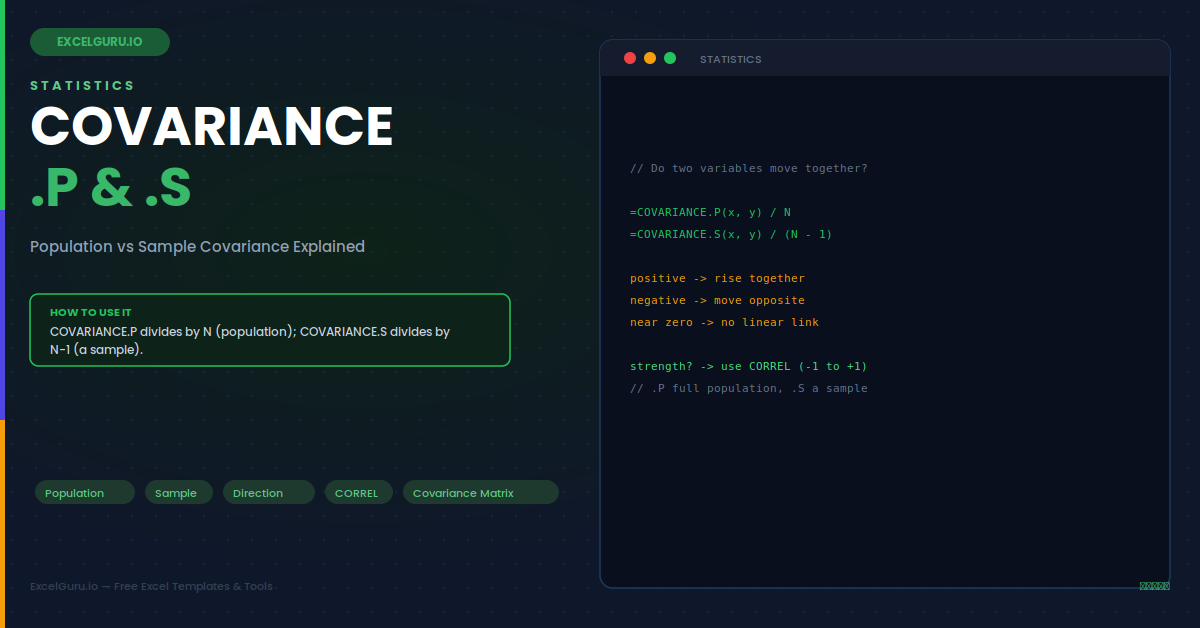
COVARIANCE.P and COVARIANCE.S functions in Excel tutorial showing covariance calculation variable relationships population and sample data analysis

COVARIANCE.P & COVARIANCE.S: Population vs Sample Covariance

Learn how to use the COVARIANCE.P and COVARIANCE.S functions in Excel to measure how two variables change together. This tutorial explains the difference between population and sample covariance, function syntax, practical examples, interpretation of positive and negative covariance, and common errors. You’ll also learn how covariance can be used alongside CORREL, PEARSON, and other statistical functions for deeper data analysis. Ideal for students, analysts, researchers, statisticians, finance professionals, and Excel users working with datasets, financial analysis, forecasting, and statistical models.

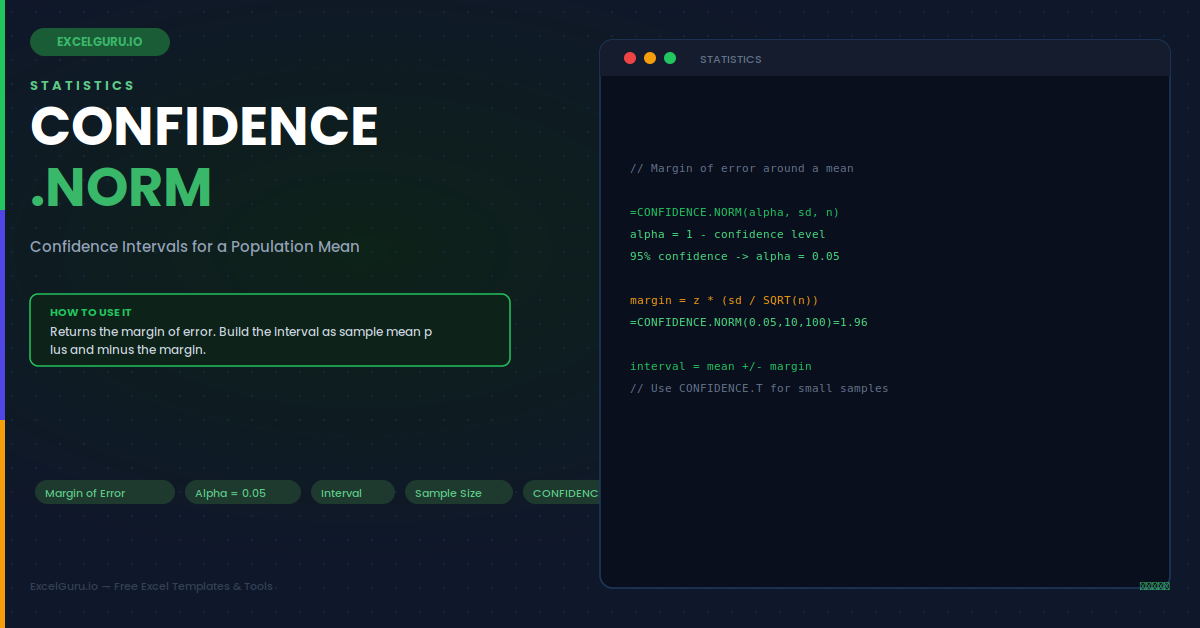
CONFIDENCE.NORM function in Excel tutorial showing confidence interval calculation normal distribution standard deviation sample size and margin of error

CONFIDENCE.NORM: Calculate Confidence Intervals for Population Mean

Learn how to calculate confidence intervals in Excel using the CONFIDENCE.NORM function. This tutorial explains the function syntax, significance level, population standard deviation, sample size, margin of error, and practical examples for estimating confidence intervals. You’ll also learn how to interpret the results and apply confidence intervals to business analysis, quality control, research, finance, and statistical reporting. Ideal for students, analysts, researchers, statisticians, and Excel users working with sample data and statistical analysis.

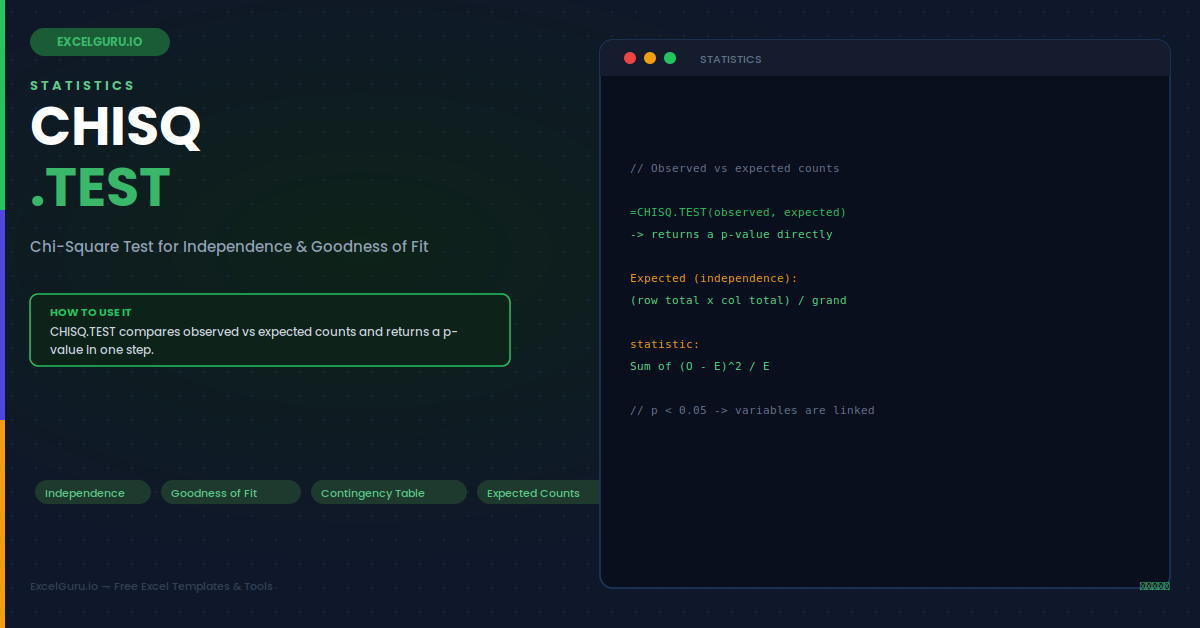
CHISQ.TEST function in Excel tutorial showing chi-square test observed versus expected values p-value calculation and statistical analysis

CHISQ.TEST: Chi‑Square Test for Independence & Goodness of Fit

Master the CHISQ.TEST function in Excel to determine whether observed data differs significantly from expected results. This tutorial explains the CHISQ.TEST syntax, required inputs, practical examples, interpretation of p-values, common errors, and best practices. You’ll also learn how to use the function for goodness-of-fit tests, tests of independence, contingency tables, hypothesis testing, and statistical data analysis. Ideal for students, researchers, analysts, statisticians, finance professionals, and Excel users working with categorical data and inferential statistics.

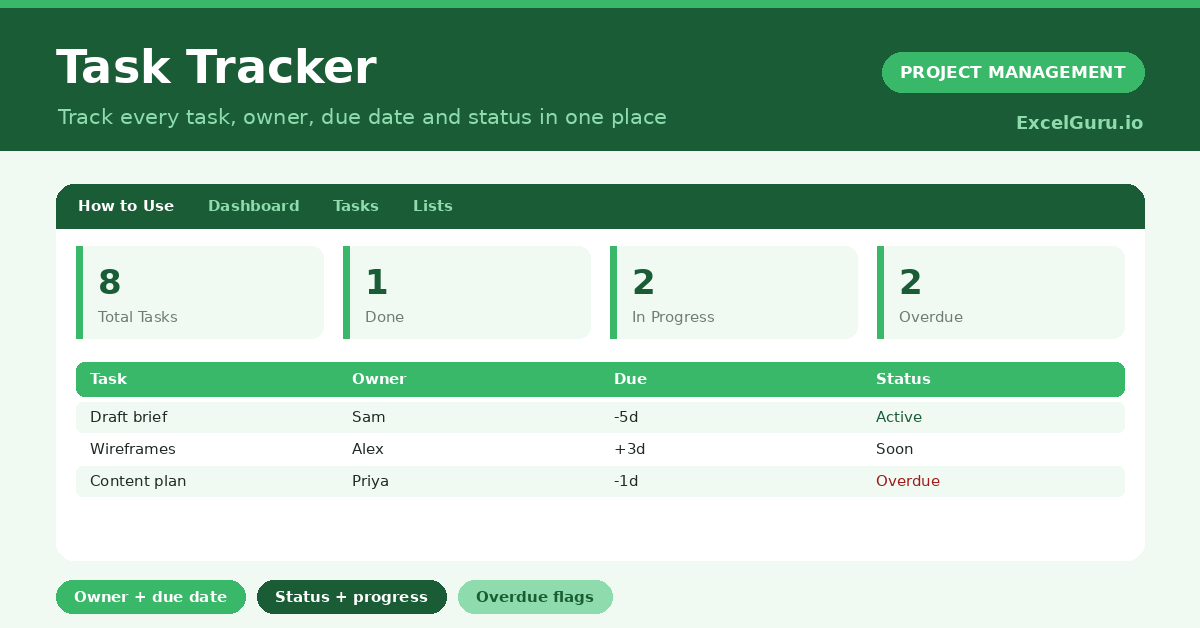
Task Tracker Excel Template for managing tasks priorities deadlines assignees progress and project status

Project Task Tracker

Stay organized and keep projects on track with this free Task Tracker Excel Template. Record tasks, assign owners, set priorities, monitor deadlines, track completion status, and measure progress in one simple Excel file. Organize work by project, category, or team while identifying overdue tasks and upcoming deadlines with ease. Ideal for project managers, business owners, freelancers, students, teams, and professionals who need a practical way to plan, monitor, and complete tasks efficiently.

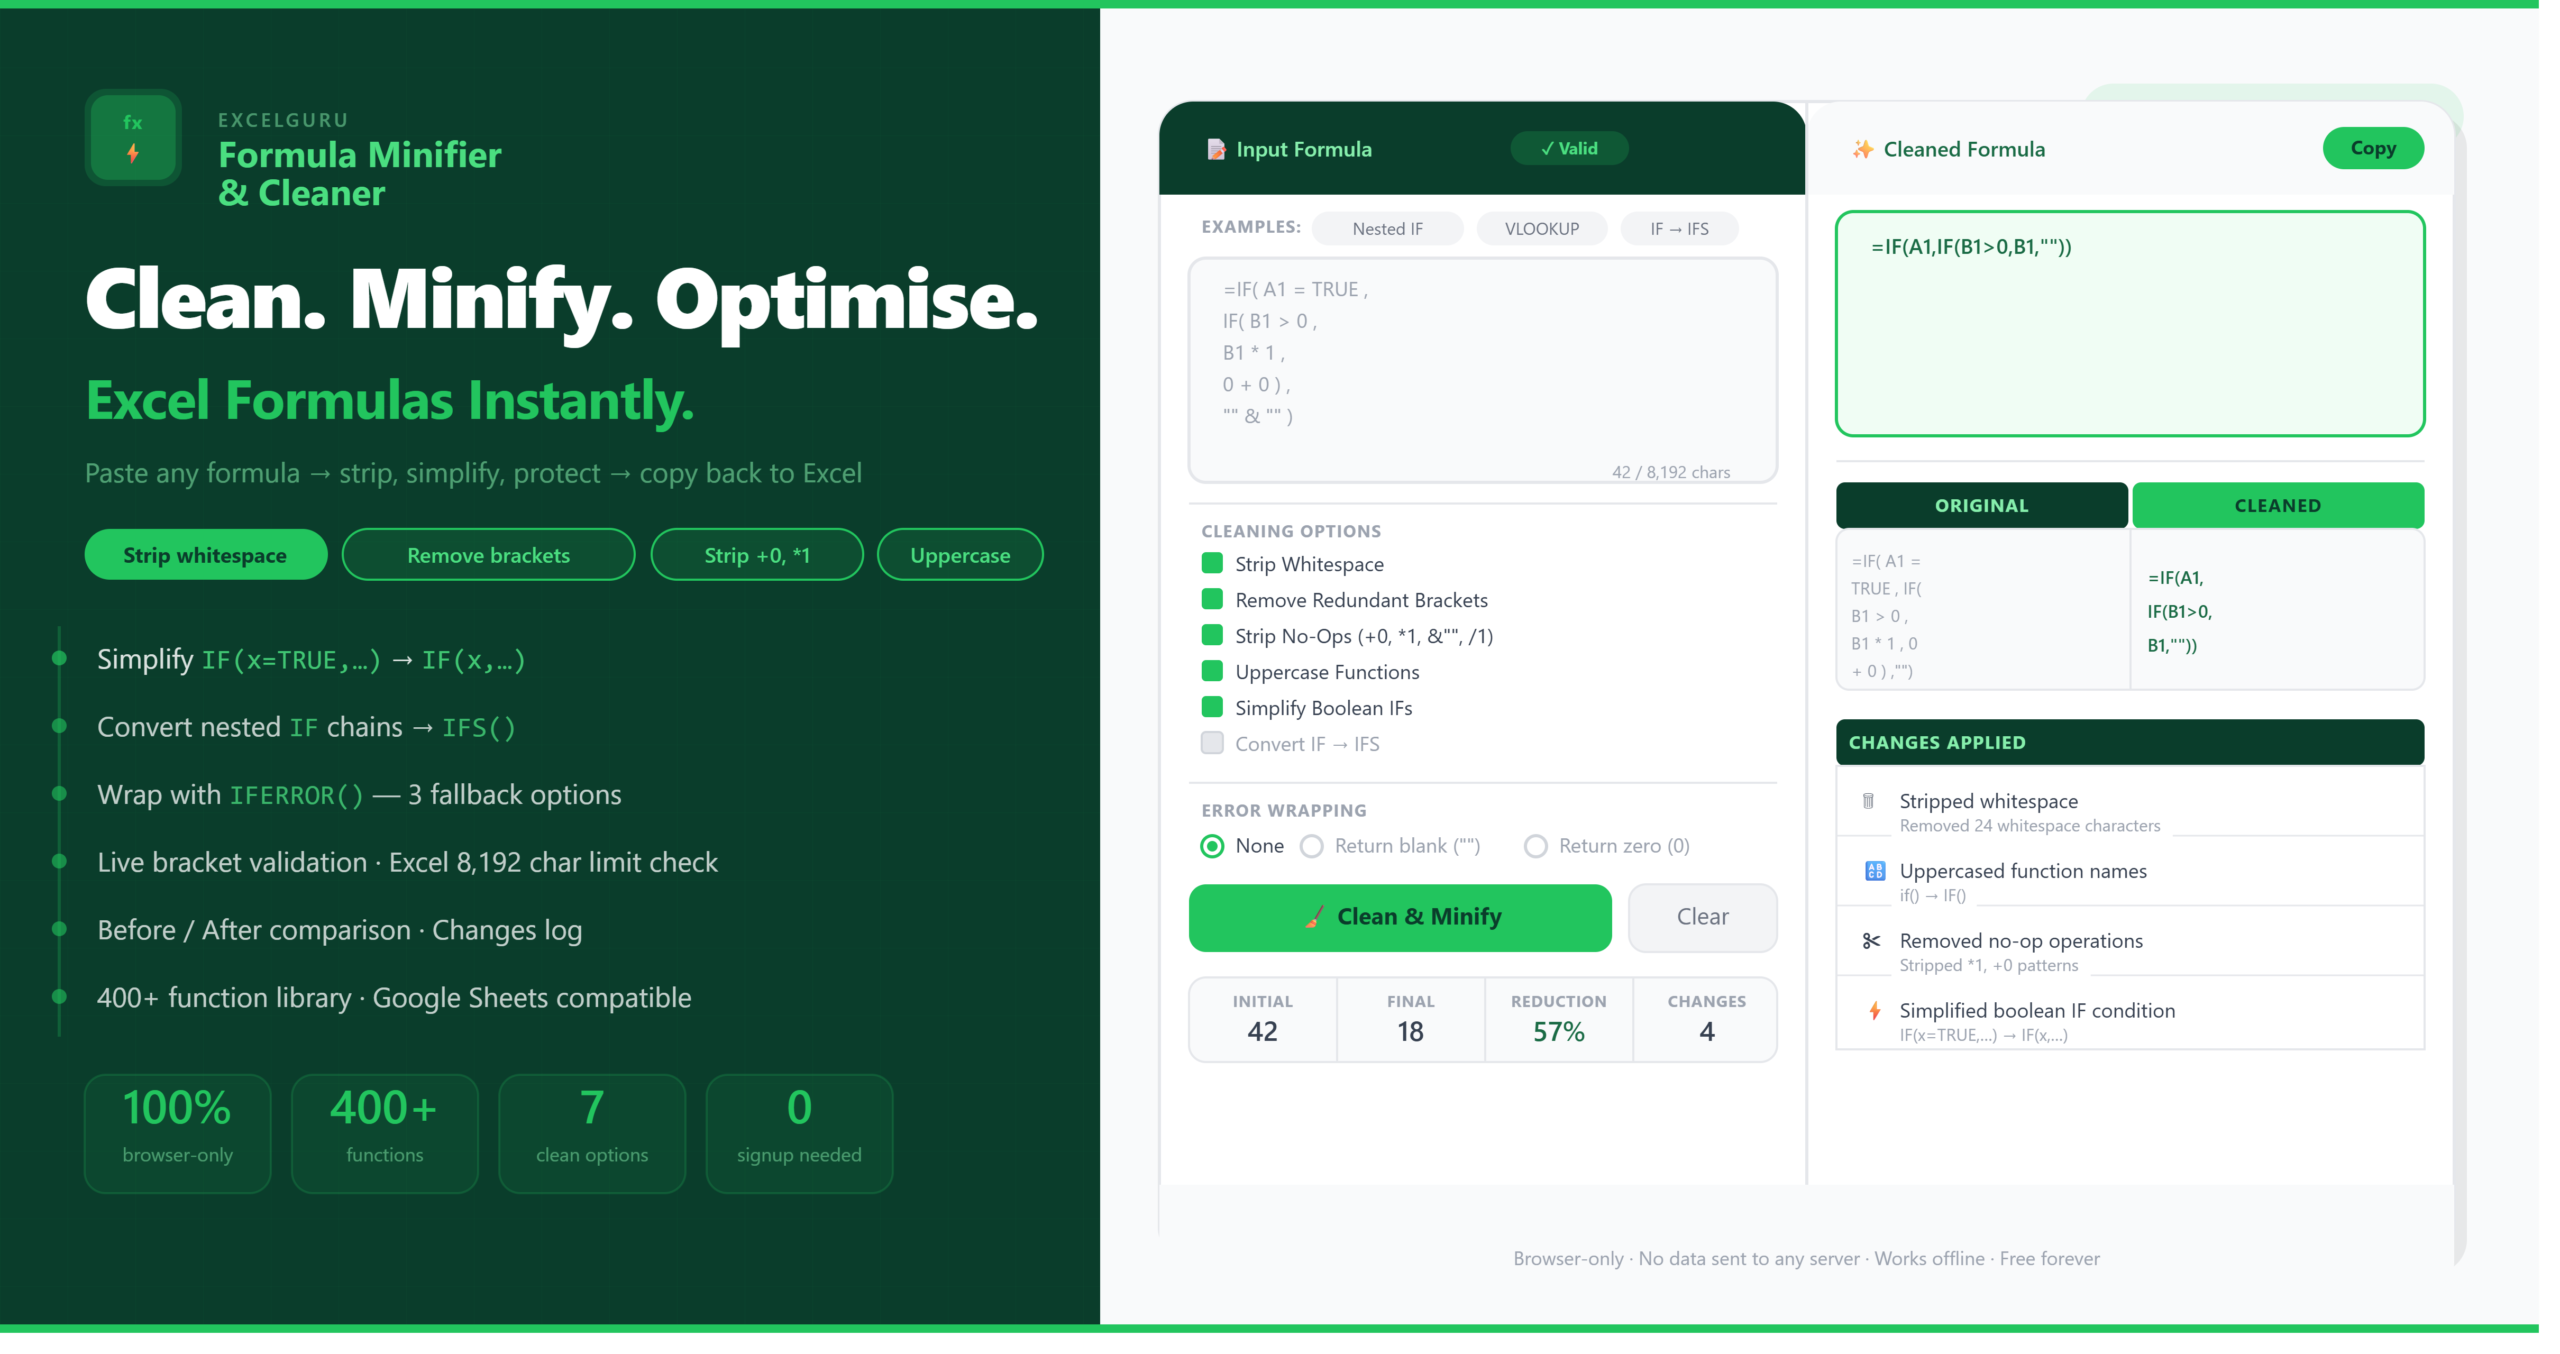
Excel Formula Minifier and Cleaner online tool for simplifying optimizing cleaning and formatting complex Excel formulas

Excel Formula Minifier and Cleaner

Working with long and complex Excel formulas? The free Excel Formula Minifier & Cleaner helps you quickly clean, optimize, and simplify formulas without changing their logic. Remove unnecessary spaces, line breaks, and formatting to create cleaner, more readable formulas that are easier to debug, maintain, and share. Whether you’re building financial models, dashboards, Power Query workflows, or advanced Excel solutions, this tool improves formula organization and productivity. Ideal for Excel users, accountants, analysts, developers, data professionals, and anyone who regularly works with complex spreadsheet formulas.

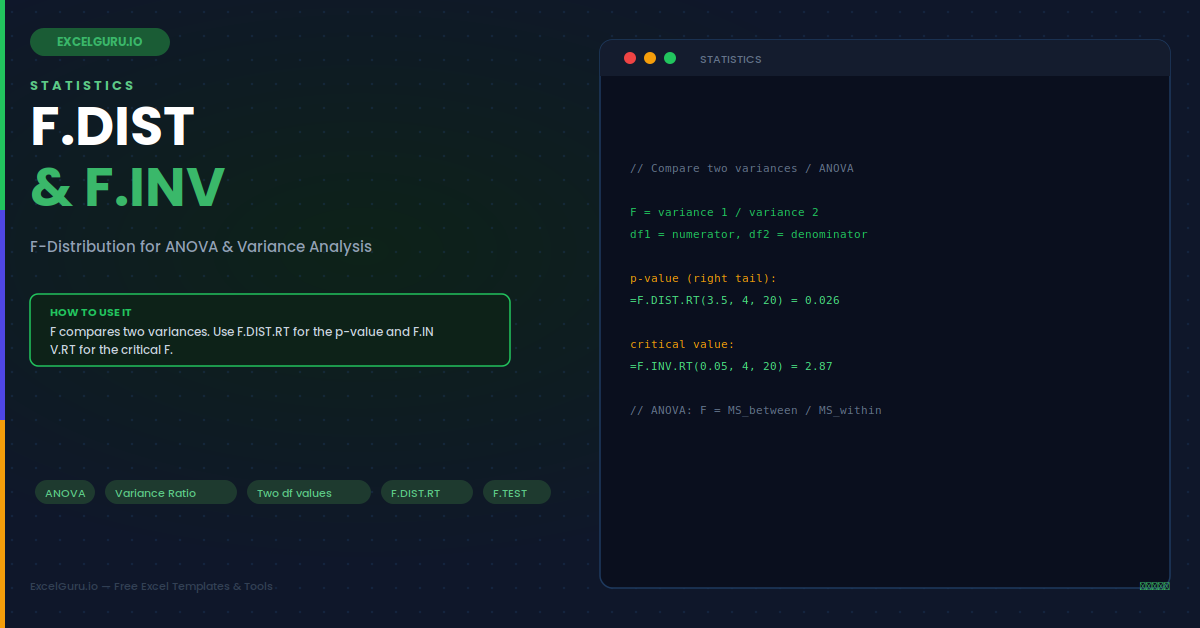
F.DIST and F.INV functions in Excel tutorial showing F-distribution probability calculations critical values ANOVA hypothesis testing and statistical analysis

F.DIST & F.INV: F‑Distribution for ANOVA & Variance Analysis

Master the F.DIST and F.INV functions in Excel to analyse data using the F-distribution. This tutorial explains the syntax, function arguments, cumulative and probability density calculations, inverse F-distribution, degrees of freedom, practical examples, and common errors. You’ll also learn how to apply these functions for ANOVA, variance comparison, hypothesis testing, confidence intervals, and statistical modelling. Ideal for students, analysts, researchers, statisticians, finance professionals, and Excel users working with inferential statistics and advanced data analysis.