
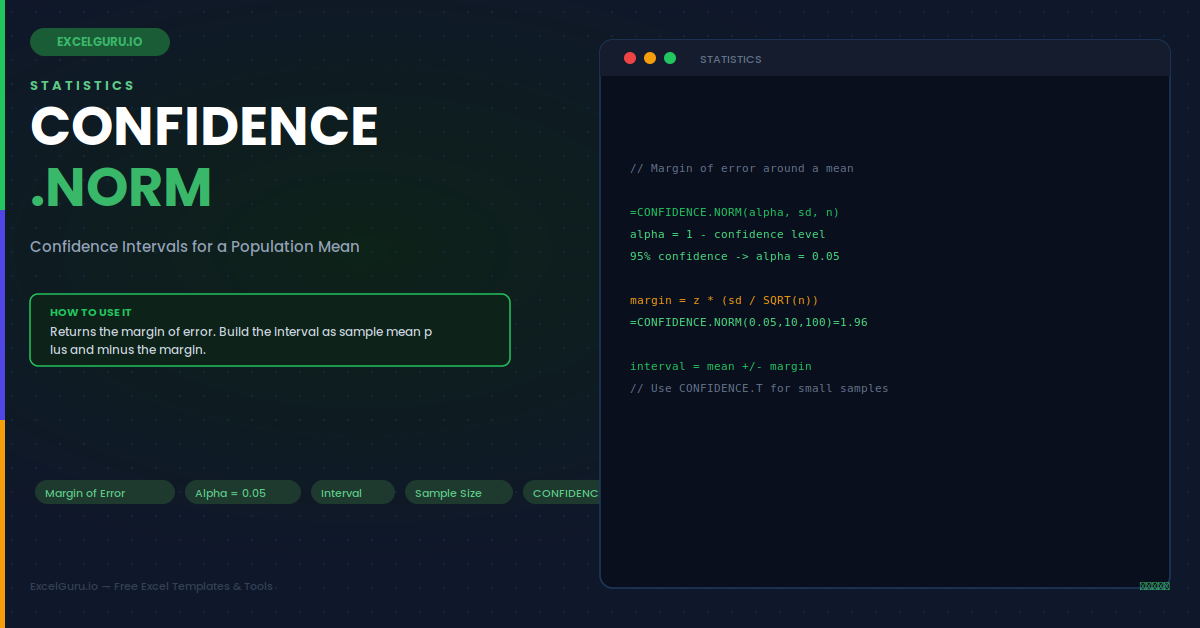
A survey says the average order is 47 dollars. But that is just your sample. The true average across all customers could be a little higher or lower. So how far off might your estimate be? A single number hides that uncertainty. A confidence interval reveals it. The CONFIDENCE.NORM function gives you the margin of error around a sample mean. Add and subtract that margin, and you get a range that likely contains the true population average.
This guide explains confidence intervals in plain language. First, it shows what the margin of error means. Then it covers the three inputs and when to use the normal version versus the t version. Seven worked examples and a full troubleshooting section follow. By the end, you will report results as a range, not a single guess.
What a Confidence Interval Tells You
To begin, a sample mean is only an estimate. Take a different sample, and you would get a slightly different number. A confidence interval captures that wobble. It gives a range around your estimate. Specifically, a 95% interval means the method captures the true mean 95% of the time. The infographic below shows the structure of an interval.
As shown, the sample mean sits at the centre. The margin of error stretches out on each side. Together they form the lower and upper bounds. CONFIDENCE.NORM computes just the margin. You supply the mean yourself and build the range around it.
The Three Inputs
CONFIDENCE.NORM needs three pieces of information. Each one plays a clear role. The confidence level sets how sure you want to be. The standard deviation sets the spread. The sample size sets how much data you have. All three shape the margin.
The Margin of Error Formula
Under the hood, CONFIDENCE.NORM applies a simple formula. It multiplies a z-value by the standard error. The z-value comes from the confidence level. The standard error is the standard deviation divided by the square root of the sample size. Seeing this helps you trust the result.
Example 1: Build a 95% Confidence Interval
Start with the most common task. You have a sample mean and want a range around it. The margin comes from CONFIDENCE.NORM. Then you add and subtract it.
Example 2: Change the Confidence Level
Notably, more confidence means a wider interval. A 99% interval must cast a bigger net than a 95% one. You change this through the alpha value. Therefore, a smaller alpha gives a larger margin.
These margins assume the same standard deviation and sample size. Notice how the margin grows as confidence rises. Consequently, demanding more certainty always costs you precision. This trade-off is worth remembering when you pick a level.
Example 3: See How Sample Size Helps
Similarly, a larger sample tightens the interval. This is one of the most useful facts in statistics. The margin shrinks with the square root of the sample size. So quadrupling the data halves the margin.
Example 4: Report a Result as a Range
In practice, a confidence interval communicates far better than a lone number. It shows both the estimate and its uncertainty. You can build a tidy report line with a formula. This reads naturally in a summary.
Example 5: CONFIDENCE.NORM vs CONFIDENCE.T
Additionally, Excel has a sibling function called CONFIDENCE.T. It uses the t-distribution instead of the normal one. The choice depends on what you know. Use the normal version for large samples or a known population spread. Use the t version for small samples with an estimated spread.
| Situation | Use this function |
|---|---|
| Large sample (about 30 or more) | CONFIDENCE.NORM |
| Population standard deviation known | CONFIDENCE.NORM |
| Small sample with estimated spread | CONFIDENCE.T |
Example 6: Plan a Sample Size in Advance
Interestingly, you can flip the logic to plan a study. Suppose you want a margin no larger than a target. You can rearrange the formula to find the needed sample size. This helps you budget data collection before you start.
Example 7: Guard Against Bad Inputs
A robust model checks its inputs. CONFIDENCE.NORM needs a valid alpha, a positive spread, and a sample size of at least 1. A short guard returns a clear message when something is off. This keeps a shared workbook friendly.
Troubleshooting CONFIDENCE.NORM
All three problems below are the most common. Each has a clear cause and a quick fix.
You get a #NUM! error
This error means an argument sits out of range. The alpha value must be greater than 0 and less than 1. A value of 0, 1, or beyond fails at once. The standard deviation must be greater than 0, so a zero or negative spread triggers the error. The sample size must be at least 1. Check each argument against these limits. A frequent slip is entering the confidence level, like 0.95, in place of alpha. Swap it for 0.05 and the error clears.
The interval seems far too wide or too narrow
An interval of the wrong size usually traces to the alpha or the sample size. If you entered 0.95 instead of 0.05, the margin collapses to almost nothing. Confirm that alpha is one minus your confidence level. Also check the sample size, since a value entered too small inflates the margin. Another cause is passing a variance where a standard deviation belongs, because the two differ greatly. Confirm you used the standard deviation, then recheck the alpha and size, and the interval width returns to normal.
Results differ from a CONFIDENCE.T calculation
A small difference between the two functions is expected, not an error. CONFIDENCE.NORM uses the normal distribution, while CONFIDENCE.T uses the wider t-distribution. For small samples, the t version gives a slightly larger margin, so the two will not match exactly. This gap shrinks as the sample grows and nearly vanishes for large samples. Choose the function that fits your situation rather than forcing them to agree. For small samples with an estimated spread, the t version is the more appropriate choice.
Frequently Asked Questions
- What does the CONFIDENCE.NORM function return?+CONFIDENCE.NORM returns the margin of error for a confidence interval around a sample mean, using the normal distribution. Notably, it does not return the interval itself, only half of its width. Specifically, you then build the full range by subtracting the margin from the sample mean for the lower bound and adding it for the upper bound. In detail, the function takes three inputs: alpha, which is one minus your confidence level; the population standard deviation; and the sample size. For example, =CONFIDENCE.NORM(0.05, 10, 100) returns about 1.96, giving a 95% interval of the mean plus or minus 1.96.
- What value should I use for alpha?+Alpha is one minus your desired confidence level, not the confidence level itself. For a 95% confidence interval, alpha is 0.05, because 1 minus 0.95 equals 0.05. Similarly, for a 90% interval alpha is 0.10, and for a 99% interval alpha is 0.01. However, this is the single most common source of mistakes with the function, since people often enter the confidence level like 0.95 by accident, which produces a tiny, meaningless margin. Therefore, always convert your confidence level to alpha first by subtracting it from 1, then pass that small value as the first argument.
- Should I use CONFIDENCE.NORM or CONFIDENCE.T?+Use CONFIDENCE.NORM when your sample is large, roughly 30 or more, or when you genuinely know the population standard deviation. Essentially, it relies on the normal distribution, which suits those conditions. By contrast, use CONFIDENCE.T when your sample is small and you estimated the standard deviation from the sample itself, which is the more common real-world situation. Specifically, the t version uses the wider t-distribution and produces a slightly larger, more cautious margin that better reflects the extra uncertainty of a small sample. In short, when unsure the t version is generally the safer and more honest choice.
- How does sample size affect the confidence interval?+A larger sample produces a narrower, more precise interval. Specifically, the margin of error shrinks in proportion to the square root of the sample size, so to halve the margin you need four times as much data. Consequently, moving from 100 to 400 observations cuts the margin roughly in half. Furthermore, this relationship shows diminishing returns, because each additional gain in precision requires progressively more data. Finally, you can use this fact in reverse to plan a study, solving for the sample size needed to achieve a target margin before you begin collecting data.