A risk register is how you deal with problems before they happen, rather than after. Every project and business faces risks, yet most are managed by crossing fingers and hoping. A register replaces hope with a plan.
This free template captures each risk, scores it by likelihood and impact, and assigns it an automatic level. It also records an owner and a mitigation for every one. As a result, you can see your biggest threats clearly and act on them before they turn into crises.
What does the risk register include?
The template is one register feeding a clear dashboard. Dropdowns keep categories and statuses tidy. In short, you get the following:
- A register with an auto ID, the risk, category, likelihood, impact, an automatic score and level, owner, mitigation and status.
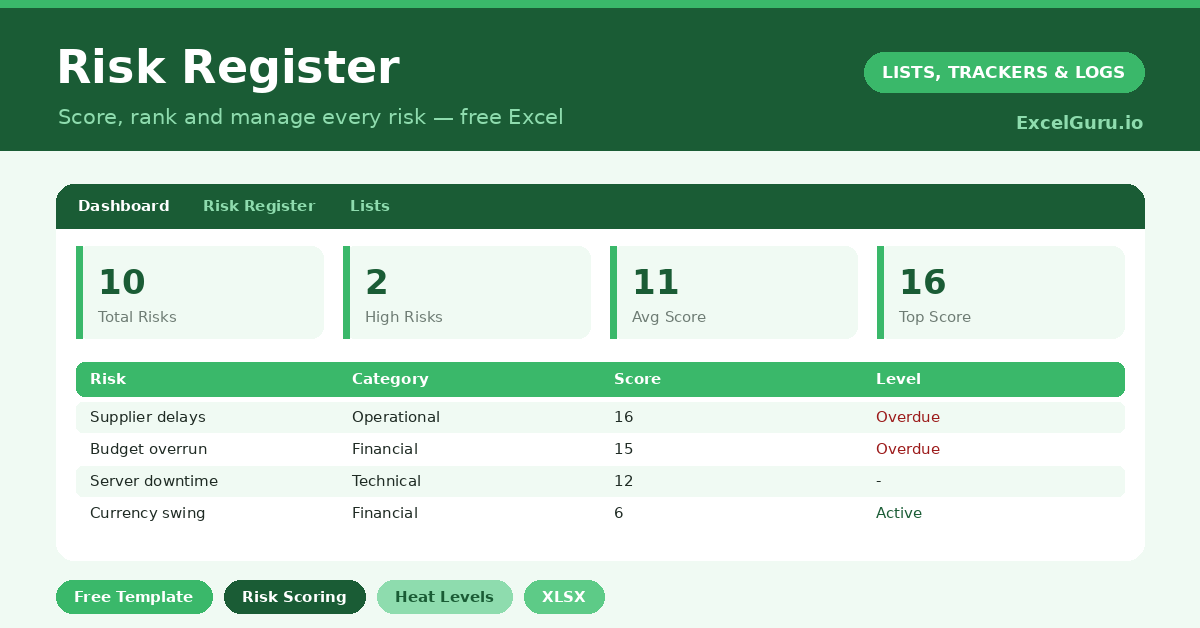
- An automatic score and level for every risk, color-coded by severity.
- Drop-down lists for likelihood, impact, category and status, so scoring stays consistent.
- A dashboard showing total risks, high risks, the average score, open and mitigating risks, and the highest score of all.
Which formulas power the risk register?
The scoring is the engine of the register. Each score is =Likelihood * Impact, the classic risk-matrix calculation, so a likely, high-impact risk scores far above a rare, minor one. That single number lets you rank everything fairly.
The level then uses a nested IF: a score of 15 or more is *High*, 8 or more is *Medium*, and the rest are *Low*, each color-coded. On the dashboard, a COUNTIF counts your high risks, an AVERAGE gives the overall risk level, and a MAX surfaces your single most severe risk. So the dashboard always points you at what matters most.
Why keep a risk register?
The value is in the thinking it forces. Writing risks down makes you confront them honestly, rather than half-acknowledging them. So a vague worry becomes a scored, owned item with a plan attached.
The scoring is what makes it practical. Because risks are ranked by likelihood times impact, you focus your energy on the few that truly threaten the project, not the many that barely register. The owner and mitigation columns turn awareness into action. Furthermore, a register is often expected in formal project governance. In short, it is how serious projects stay ahead of trouble.
What does the dashboard reveal?
The dashboard gives you a one-glance read on your exposure. The high-risk count is the headline, since those are the threats that demand attention now. The highest-score figure flags your single most dangerous risk.
The average score gives a sense of the project’s overall risk temperature, which is useful to track over time. The open and mitigating counts show how much of your risk is being actively managed. Because the numbers update as you rescore, you can watch your exposure fall as mitigations take effect. So the dashboard turns risk from a vague anxiety into a managed metric.
How do you run a register?
Begin by brainstorming risks broadly, then score each one for likelihood and impact. So the worst threats rise to the top automatically. Assign every significant risk an owner, because an unowned risk is an unmanaged one.
For each, write a clear mitigation: what you will do to reduce the likelihood or soften the impact. Then review the register regularly, rescoring as circumstances change and closing risks that have passed. Because the register is a living document, it reflects reality rather than a snapshot from kick-off. In short, it keeps risk management active throughout the project.
How do you customize it?
Edit the categories and statuses on the Lists tab to match your context, whether that is a project, a business or an event. Additionally, you can add columns for a target resolution date, a residual score after mitigation, or a contingency plan. The likelihood and impact scales can be relabeled if your organization uses its own. The template fits most risk frameworks with minimal changes.
What mistakes should you avoid?
The first mistake is treating the register as a one-off document written at the start and never revisited. Risks change, so review it regularly. The second mistake is scoring everything as high, which defeats the purpose of prioritizing.
Be honest and consistent with likelihood and impact, so the ranking means something. Finally, do not log a risk without an owner and a mitigation. A risk that nobody owns and nobody plans for is just a worry written down. The point is to manage it, not merely to record it.
Frequently asked questions
How does the risk register score risks?
Each risk’s score is its likelihood multiplied by its impact, the standard risk-matrix method. A nested IF then labels it high, medium or low, so your most serious risks rise to the top automatically.
What do the levels mean?
A score of 15 or more is high, 8 or more is medium, and below that is low, each color-coded. The dashboard counts your high risks and flags the single highest score for immediate attention.
Can I use it for any project?
Yes. Edit the categories and scales on the Lists tab to fit your context, whether a project, a business or an event. The scoring and dashboard work the same whatever risks you track.
Capture your risks, score them honestly, and give each an owner and a mitigation. The dashboard then keeps your biggest threats in view. A risk register is not paperwork for its own sake; instead, it is the simple discipline that lets you handle problems on your terms, before they handle you.