
A running log is what turns a string of separate runs into visible, motivating progress. Without a record, every run feels much the same, and you cannot tell whether you are actually getting fitter. So writing down each run, with its distance and time, is the simplest way to see yourself improve.
This free template records each run and works out your pace automatically. So it tracks your weekly mileage, your average pace and your longest run. As a result, you can spot the trends that keep you motivated and train with a bit more purpose.
What does the running log include?
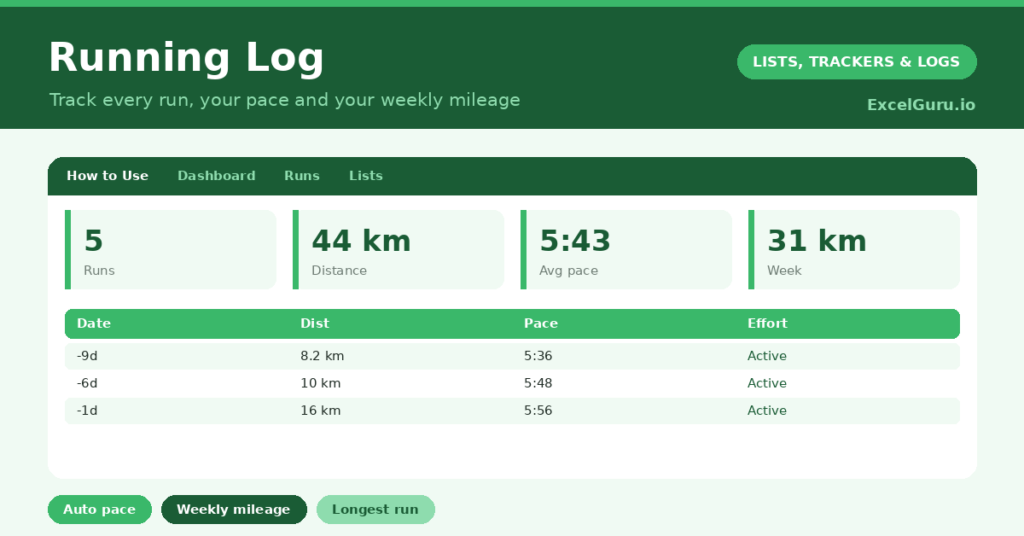
The template is one run log feeding a clear dashboard. A dropdown keeps the effort levels tidy. In short, you get the following:
- A run log with the date, distance, duration, an auto-calculated pace, average heart rate, effort, route and notes.
- An automatic pace in minutes per kilometre for every run.
- A dropdown for effort, so easy, moderate and hard runs are easy to compare.
- A notes column for how the run felt, the weather, or how your legs held up.
- A dashboard showing total runs, total distance, total time, average pace, your longest run and this week’s mileage.
Which formula powers the running log?
The key formula does the pace maths you would otherwise do in your head. Your pace is =Duration / Distance, so a 28-minute run over 5 kilometres reads as 5.6 minutes per kilometre. It calculates the moment you enter a run.
On the dashboard, the average pace is =SUM(time) / SUM(distance), which weights by distance rather than averaging individual paces, so it is genuinely accurate. A SUMPRODUCT then totals only this week’s distance, and a MAX finds your longest run. So the dashboard turns a list of runs into a clear picture of your training.
Why keep a running log?
Motivation is the biggest benefit. Seeing your mileage add up and your pace edge down is genuinely encouraging, and it keeps you lacing up on the days you would rather not. So the log helps build the habit.
It also makes you a smarter runner. The weekly mileage figure helps you increase your training gradually, which is the safest way to avoid injury. The effort column reminds you to mix easy and hard runs rather than grinding at one pace. Furthermore, looking back at your notes can reveal what helps you run well. In short, the log supports both consistency and sensible progress.
What does the dashboard reveal?
The dashboard sums up your running in a glance. The average-pace figure is the headline measure of fitness, and watching it improve over weeks is hugely satisfying. So it is the number most runners love to track.
This week’s mileage helps you manage your training load, since jumping it up too fast is a common cause of injury. The longest-run figure marks your endurance milestones, and the total distance shows just how far you have come. Because it all updates with every run, the trend is always current. So the dashboard keeps you motivated and training sensibly.
How do you use Excel for tracking your running history?
The habit is simple: log each run as soon as you finish. So nothing is forgotten. Enter the distance and duration, and your pace appears, while a note about how it felt adds useful context.
Set the effort honestly, because a training plan works best with a mix of easy and hard sessions. Then check the dashboard each week, watching your mileage and average pace. Because the record builds over time, a month or two in you will see clear, motivating progress. In short, a minute of logging after each run pays off in steady improvement.
How do you customize it?
If you prefer miles to kilometres, simply rename the headers, since the formulas only work with the numbers. Additionally, you can add columns for the shoes you wore, the elevation gained, or how you felt on a simple scale. A weekly mileage target is a useful motivator. The template suits a casual jogger or a runner training for a marathon.
What mistakes should you avoid?
The first mistake is increasing your weekly mileage too quickly, which the dashboard can tempt you to do. So build up gradually, and let the weekly figure guide a sensible increase. The second mistake is logging only your best runs.
The easy and slow runs matter just as much, so record them all for an honest picture. Finally, do not obsess over a single slow run. A bad day means little; it is the trend across weeks that tells the real story. Watch the average, not the outlier.
Frequently asked questions
How does the running log calculate pace?
It divides your run duration by the distance, so a 28-minute 5km run shows a pace of 5.6 minutes per kilometre. The dashboard’s average pace weights by distance for an accurate overall figure.
Can I use miles instead of kilometres?
Yes. Just rename the headers to miles, and enter your distances consistently. The pace and mileage formulas work with whatever unit you log.
Will it help me train for a race?
It can. The weekly mileage figure helps you build up gradually and safely, the effort column encourages a mix of run types, and the longest-run figure tracks your endurance toward race distance.
Log every run, let the pace calculate, and watch your weekly mileage and average pace on the dashboard. A running log is a tiny habit with an outsized payoff: it keeps you motivated, helps you train sensibly, and shows you the steady progress that a single run never can.