
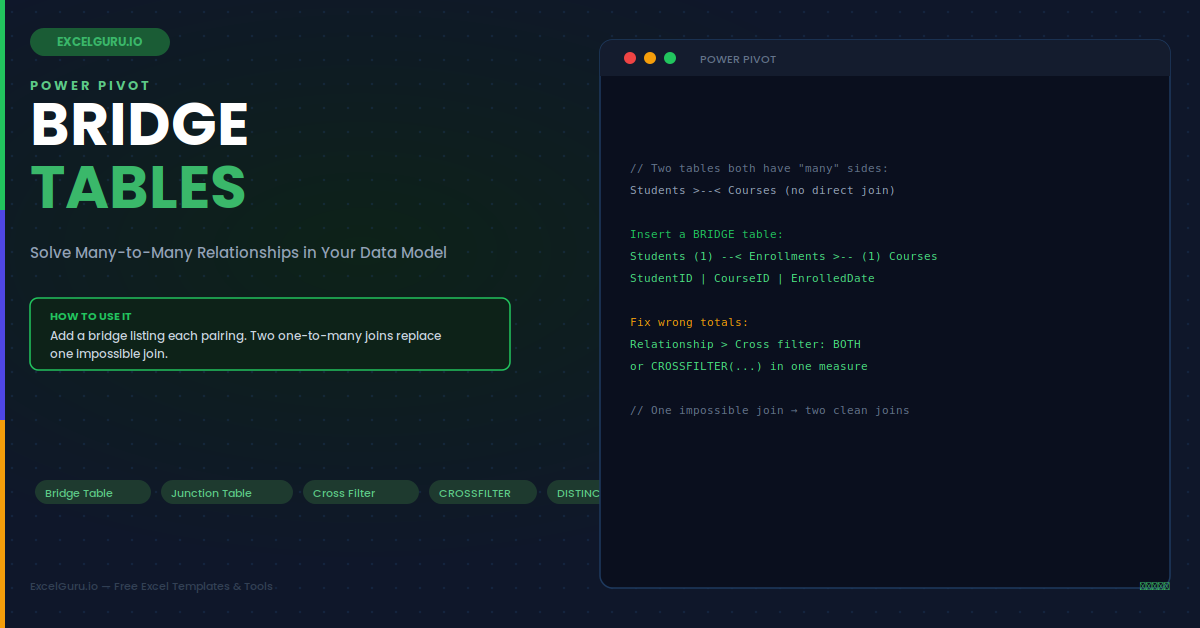
You build a data model, drag in a measure, and the numbers come out wrong. Every customer shows the same grand total, or a filter simply refuses to work. Nine times out of ten the culprit is a hidden many-to-many relationship. Two tables each have multiple matches on the other side, with no clean one-to-many link between them. Power Pivot cannot join them directly. The fix is a bridge table — a small intermediate table that sits between them. It translates the relationship into two clean one-to-many joins the engine can actually follow.
This guide explains exactly when a many-to-many situation arises, how a bridge table resolves it, and how to control filter direction so your measures total correctly. It works through six real modelling scenarios and the traps that produce silently wrong numbers.
The Problem: When Two Tables Both Have "Many" Sides
A one-to-many relationship is the clean case Power Pivot loves: one customer, many orders. A many-to-many relationship is different — each row on one side can match several rows on the other, and vice versa. A student takes many courses; a course has many students. Neither table can be the "one" side, so a direct join is impossible.
Anatomy of a Bridge Table
A bridge table (also called a junction or link table) is deliberately minimal. It typically holds just the two key columns that connect the tables it bridges, and sometimes a few attributes about the pairing itself. Keeping it lean keeps the model fast and the relationships obvious.
Each StudentID appears as often as that student has courses, and each CourseID appears as often as that course has students. On its own the table is unremarkable. In the model it is the linchpin that makes both dimensions filter correctly.
Building the Relationships — Step by Step
With the bridge table loaded into the model, you create two relationships, each running from a dimension table into the bridge. Both point the same way: the "one" side is the dimension, the "many" side is the bridge. This is the arrangement Power Pivot understands natively.
Cross-Filter Direction — The Setting That Fixes Wrong Totals
By default, filters in Power Pivot flow only from the "one" side to the "many" side. Through a bridge, that default often stops a filter halfway, so one dimension cannot filter the other and totals come out wrong. Setting the relationship's cross-filter direction to Both lets the filter travel all the way across the bridge. This one setting is the difference between correct and nonsensical numbers.
Example 1: Students and Courses — The Classic Case
The enrollment model above answers questions neither table could answer alone. With the bridge in place and bidirectional filtering on, a PivotTable can show how many students each course has, how many courses each student takes, and — with a Grades fact table — the average grade per course filtered by student attributes. The bridge is what lets a filter on one dimension reshape the other.
Example 2: Products and Sales Regions
A product can be sold in many regions, and a region sells many products — another many-to-many. A ProductRegion bridge lists which products are available in which regions. This lets a dashboard answer "how many regions stock this product?" and "which products are approved for this region?" from the same model, without duplicating product rows per region in the fact table.
Example 3: Accounts and Account Holders (Joint Accounts)
Banking data is full of many-to-many relationships. One person can hold several accounts, and one account (a joint account) can have several holders. A Holdings bridge captures each person-account link. This resolves the double-counting problem that plagues joint-account reporting, where naively summing balances per person inflates totals because a shared balance gets counted for each holder.
Example 4: A Bridge That Also Carries Attributes
A bridge does not have to be only key columns. The pairing itself can have properties worth storing. In the enrollment example, each row can also record the enrolment date, a status, or a role. These pairing-level attributes become filterable dimensions in their own right, letting you slice by "enrolments this term" or "active pairings only" directly from the bridge.
Example 5: Controlling Filter Direction Inside One Measure
Sometimes you want bidirectional filtering for one calculation but not another. Rather than changing the model globally, the CROSSFILTER function switches direction inside a single measure. This gives surgical control: one measure filters both ways across the bridge, while the default single-direction behaviour stays intact everywhere else. It is the cleaner alternative to flipping a model-wide switch.
Example 6: The Modern Alternative — A Native Many-to-Many Measure
Newer versions of Power Pivot and the underlying engine can sometimes relate two tables through a shared dimension without a physical bridge, using DAX to virtualise the link. However, an explicit bridge table remains the most transparent and portable approach. It shows the relationship plainly in Diagram View, works across every version, and is far easier for the next person to understand than a clever but invisible DAX pattern.
Troubleshooting Many-to-Many Models
All three problems below are the most common many-to-many pitfalls. Each produces a recognisable symptom with a specific fix.
Every row in the PivotTable shows the same grand total
This classic symptom means a filter is not reaching the table it should filter. The dimension you are slicing by cannot push its filter across the bridge to the measure's table, so every row receives the unfiltered total. Open the relationship between the dimension and the bridge and set its cross-filter direction to Both, or use CROSSFILTER inside the measure. After enabling bidirectional filtering on the correct relationship, the filter travels across the bridge and each row recalculates for its own context instead of showing the identical grand total everywhere.
Totals are inflated — values are being double-counted
Inflated totals happen when a many-to-many join fans out a value across multiple matching rows, so a single amount gets summed more than once. This is common with joint accounts, shared resources, or any shared entity. Avoid summing the raw fact directly across the bridge; instead wrap the calculation so each underlying value counts once, using DISTINCT or SUMX over the distinct dimension keys. Deciding the correct grain — should a shared balance count once, or once per holder — is a business question, and the measure must be written to match that intended definition.
Power Pivot refuses to create the relationship or reports ambiguity
If Power Pivot blocks a relationship or warns about ambiguous paths, there are usually two or more routes a filter could take between the same tables, and the engine cannot choose. This often follows setting too many relationships to Both. Deactivate or remove the redundant relationship so only one clear path exists between any two tables, keeping bidirectional filtering on just the single bridge link that needs it. Also confirm the bridge key columns contain matching values and data types on both sides, because a type mismatch can block the relationship from forming at all.
Frequently Asked Questions
- What is a bridge table in Power Pivot?+A bridge table (also called a junction or link table) is a small intermediate table that resolves a many-to-many relationship between two other tables. It contains one row for each valid pairing — for example, each student-course combination — with the key columns of both tables it connects. Because each of its two keys links on the "many" side to a dimension's "one" side, it converts a single impossible direct join into two clean one-to-many joins that Power Pivot handles natively. It can also carry attributes about the pairing itself, such as a date or status.
- Why do my measures show the same total for every row?+This almost always means a filter cannot travel across the bridge to reach the measure's table. By default, Power Pivot filters flow only from the "one" side to the "many" side, so a filter can reach the bridge but not climb back up into the other dimension. The fix is to set the cross-filter direction of the relevant bridge relationship to Both, which lets the filter flow all the way across. Alternatively, use the CROSSFILTER function inside the specific measure to enable bidirectional filtering for that calculation only.
- Should I set every relationship to bidirectional filtering?+No. Setting many relationships to Both can create ambiguous or circular filter paths that Power Pivot cannot resolve, and it may block relationships or slow the model. Enable bidirectional filtering only on the specific bridge relationship that requires it, and leave the rest single-direction. For calculations that need cross-filtering only occasionally, prefer the CROSSFILTER function inside a single measure over a model-wide setting. This keeps the default behaviour predictable while giving the one measure the direction it needs.
- How do I avoid double-counting in a many-to-many model?+Double-counting happens when a shared value — like a joint account balance — is summed once for each matching row across the bridge. To prevent it, do not sum the raw fact directly across the many-to-many join. Instead, write the measure so each underlying value is counted once, for example by using SUMX over DISTINCT dimension keys and pulling each distinct value with VALUES. First decide the correct business grain: should a shared amount count once overall, or once per participant? Then write the measure to match that definition exactly, so the totals reflect reality rather than the fan-out of the join.