
Key takeaways
- A single-number forecast hides risk. Monte Carlo shows the full range of outcomes.
- Model inputs as distributions (normal, triangular, uniform, constant) instead of fixed cells.
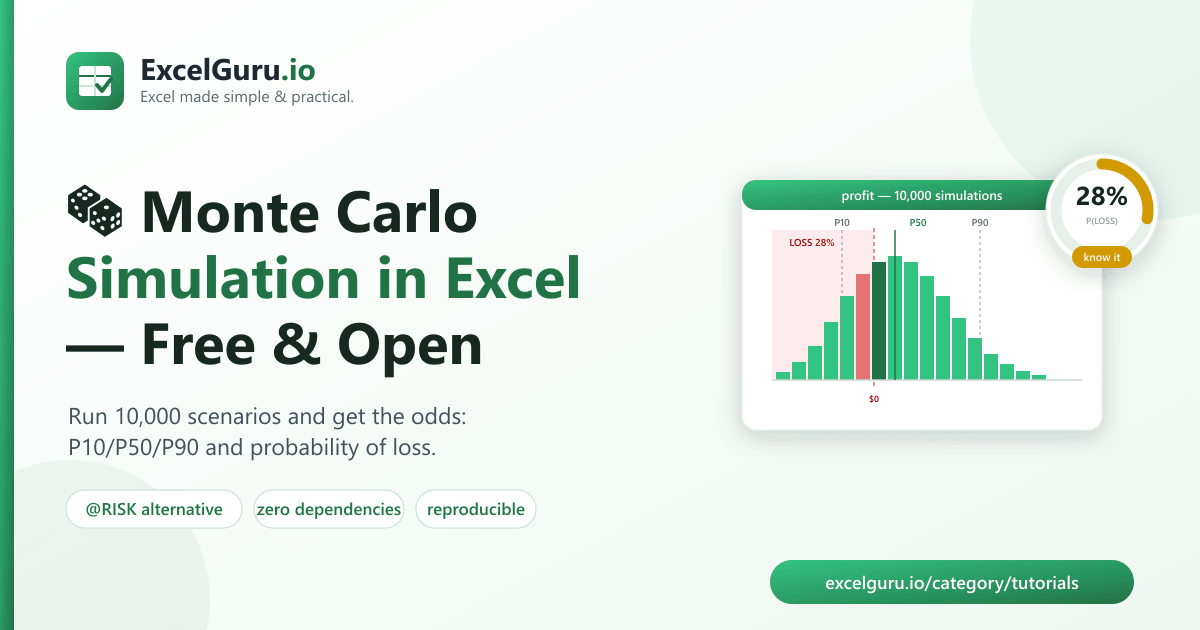
- Get P10 / P50 / P90 percentiles and the probability of any target (e.g. "28% chance of a loss").
- A safe, free alternative to @RISK / Crystal Ball — zero dependencies, no macros.
- Open-source (MIT) and downloadable from GitHub.
Excel Monte Carlo Simulator is a free, open-source tool that runs thousands of "what-if" scenarios on your model and tells you the odds — not just a single guess. Define your uncertain inputs as probability distributions, and it returns P10/P50/P90 outcomes and the probability of hitting any target (like the chance of a loss). It's a lightweight, free alternative to paid add-ins such as @RISK and Crystal Ball — no eval, no macros, no cost.
Why one number is a dangerous forecast
Build a profit model in Excel and you'll usually plug in a "best guess" for price, cost, and volume, then read off a single profit figure. The problem: every one of those inputs is uncertain, and multiplying uncertain numbers together compounds the risk. Your tidy "$35,000 profit" might really be anywhere from a $10,000 loss to $80,000 — and the single cell never tells you that.
Monte Carlo simulation fixes this. Instead of one value per input, you describe each as a range with a shape (a probability distribution). The simulator then runs your model thousands of times, each run drawing a random value from each distribution, and collects all the results. What comes back isn't a guess — it's a picture of everything that could plausibly happen, and how likely each part is.
How it works in three ideas
| Concept | What it means |
|---|---|
| Distributions | Each uncertain input becomes a shape: normal (mean ± spread), triangular (min/most-likely/max — great for expert estimates), uniform (equally likely range), or constant. |
| Trials | The model is evaluated thousands of times (10,000 by default), each with fresh random draws. |
| Percentiles | Results are summarized as P10 (pessimistic), P50 (median), and P90 (optimistic) — plus the probability of clearing any threshold you set. |
How to download & set up (about 1 minute)
Free and open-source on GitHub, with zero dependencies — it uses only Python's standard
library, so there's nothing to pip install. You just need Python 3.9+.
- Download the code (or Code → Download ZIP on GitHub):
git clone https://github.com/Synth88Labs/excel-monte-carlo.git cd excel-monte-carlo - Describe your model in a small JSON file — your uncertain inputs and the formula that
produces the output:
{ "variables": { "price": { "dist": "normal", "mean": 50, "std": 5 }, "unit_cost": { "dist": "triangular", "low": 28, "mode": 30, "high": 36 }, "units_sold": { "dist": "normal", "mean": 1000, "std": 150 }, "fixed_cost": { "dist": "constant", "value": 15000 } }, "output": "(price - unit_cost) * units_sold - fixed_cost" } - Run the simulation and ask a question — e.g. the probability of a loss:
python montecarlo.py profit_model.json --trials 10000 --seed 42 --below 0
⬇️ Get Excel Monte Carlo Simulator on GitHub (free)
--seed and everyone who runs the model gets the
exact same numbers — important when you're sharing results with a team or a board. Use --above
/ --below to ask "what's the probability the output clears this line?"
A worked example
Running the sample profit model above:
python montecarlo.py sample_data/profit_model.json --trials 10000 --seed 42 --below 0

Excel Monte Carlo Simulator
  Trials: 10,000   Output: (price - unit_cost) * units_sold - fixed_cost
  Mean:   5,014
  P10:   -6,528    P50:  4,842    P90:  16,890
  P(output < 0): 28.1%
The "best guess" profit looked positive — but the simulation reveals a 28.1% chance of losing money, and a realistic downside (P10) near –$6,500. That's the difference between a number and a decision. Now you can act: raise price, lock in costs, or accept the risk with eyes open.
Real-world uses
- Project budgeting — probability a project comes in over budget.
- New-product P&L — odds a launch is profitable given uncertain demand and cost.
- Sales pipeline — expected bookings when each deal has a close probability.
- Cost estimation — total cost range when line items are "min / likely / max" guesses.
- Investment / ROI — distribution of returns instead of a single rosy figure.
Is it safe? (Yes — and here's why that matters)
Many spreadsheet "formula" tools quietly use Python's eval(), which can run any
code hidden in a model file. This simulator does not. It parses your output formula into a safe
expression tree and only allows arithmetic and a short ALLOWLIST of math functions
(min, max, abs, round, sqrt, exp, log). A model file can't touch your files or system — a
property we cover with an explicit security test in the repo.
Frequently asked questions
Is this Monte Carlo tool free?
Yes — open-source under the MIT license, free for personal and commercial use.
How is it different from @RISK or Crystal Ball?
Those are paid Excel add-ins. This is a free, scriptable, zero-dependency tool that does the core job — distributions, thousands of trials, percentiles, and probability-of-target — without a license or macros.
Which distributions are supported?
Normal, triangular, uniform, and constant. Triangular is ideal for expert "min / most-likely / max" estimates.
How many trials should I run?
10,000 is a good default and runs in a moment. More trials give smoother, more stable percentiles.
Do I need to install anything?
Just Python 3.9+. The tool has no third-party dependencies — nothing to pip install.
Can I get the same results twice?
Yes — pass --seed and the run is fully reproducible, so a teammate sees identical numbers.
Summary
A single-cell forecast pretends the future is certain. Excel Monte Carlo Simulator runs thousands of scenarios and hands you the odds — P10/P50/P90 and the probability of any target — as a free, safe, open-source alternative to @RISK and Crystal Ball. Download it, describe your model in a few lines of JSON, and start making decisions with the real range in front of you.