
Key takeaways
- Reorder point = the stock level that triggers a new order — computed per SKU.
- Safety stock is the buffer for demand that's higher than average during lead time.
- You pick the service level (e.g. 95%); the tool converts it to the right buffer.
- Works from your demand history CSV — no guessing, no manual z-tables.
- Free, open-source (MIT), downloadable from GitHub.
Excel Inventory Forecast is a free, open-source tool that calculates the right safety stock and reorder point for every SKU from your demand history. Feed it past sales, set your supplier lead time and target service level, and it returns exactly when to reorder each item — so you stop out less often without drowning in excess stock. It's the proper statistical formula, done for you, per SKU.
The two mistakes every stockroom makes
Order too late and you stock out — lost sales, backorders, and customers who buy from someone else. Order too early or too much and you tie up cash in shelves of product that may never move. Most businesses "solve" this with gut feel or a flat "reorder when we hit 50," which ignores how fast the item actually sells and how long the supplier takes to deliver.
The real answer is two numbers per SKU: a reorder point (when to order) and a safety stock (how much buffer to hold for bad-luck demand). Both depend on your demand variability, your lead time, and how often you're willing to stock out. This tool computes them correctly, for every product, in one run.
How the math works (in plain English)
| Number | What it captures |
|---|---|
| Average demand × lead time | How much you'll sell while waiting for the new order to arrive. |
| Safety stock | A buffer sized from your demand's variability, your lead time, and your chosen service level: z × std × √lead_time. |
| Reorder point | The two added together — order when stock drops to this level. |
| Service level → z | You say "I want to be in stock 95% of the time"; the tool finds the matching safety factor (z) for you. |
How to download & set up (about 2 minutes)
Free and open-source on GitHub. You'll need Python 3.9+.
- Download the code (or Code → Download ZIP on GitHub):
git clone https://github.com/Synth88Labs/excel-inventory-forecast.git cd excel-inventory-forecast - Install the two dependencies (pandas & openpyxl):
pip install -r requirements.txt - Run it on your demand history — a CSV with a SKU column and a units-sold column:
python inventory.py demand_history.csv --lead-time 7 --service-level 0.95
⬇️ Get Excel Inventory Forecast on GitHub (free)
--service-level to 0.99 for critical items (bigger
buffer, fewer stockouts) or lower it to 0.90 for cheap, easily-restocked ones (less cash tied up). The
tool re-computes the reorder point for each choice instantly.
A worked example
Two SKUs, a 7-day lead time, and a 95% service level:
python inventory.py sample_data/demand_history.csv --lead-time 7 --service-level 0.95

Excel Inventory Forecast   (lead time 7 days, service level 95%)
  SKU   avg/day   std     safety stock   reorder point
  A      18.4     4.9        24.4            153.6
  B       5.1     2.3        10.4             47.1
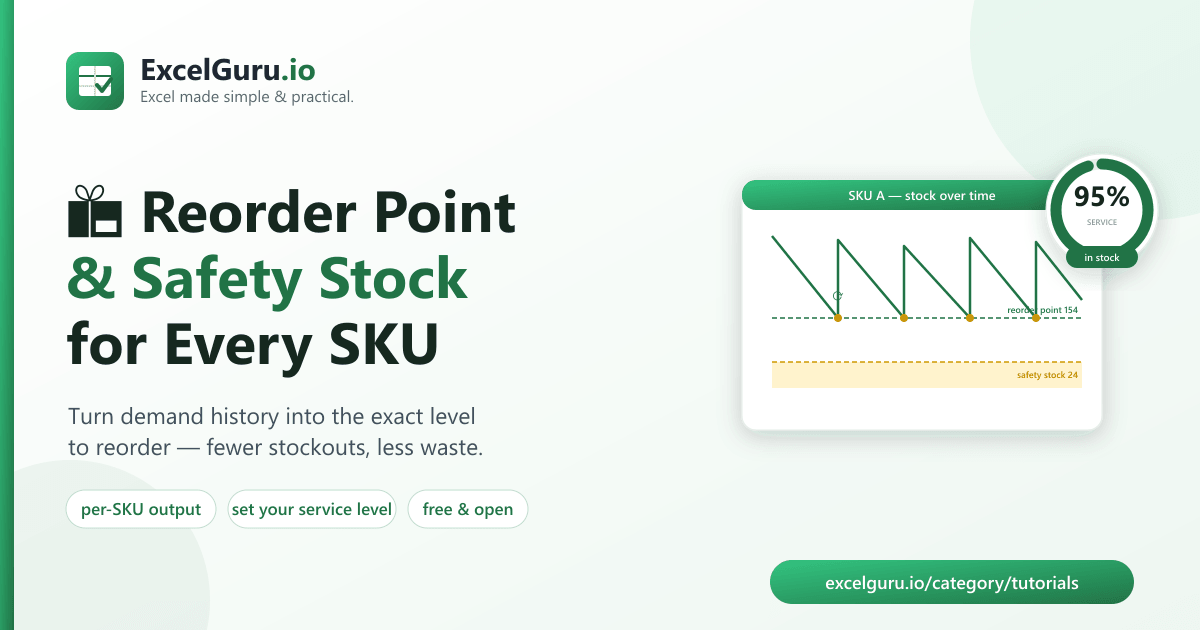
For SKU A, you sell about 18/day, so you'll burn ~129 units during the 7-day wait; adding a 24-unit safety buffer gives a reorder point of 154. Drop to 154 on hand and it's time to reorder — early enough to cover normal demand swings, lean enough not to overstock. SKU B, slower and steadier, needs a much smaller buffer. One command sizes both correctly.
Who this helps
- E-commerce & retail — set reorder points per SKU instead of one blanket rule.
- Warehouse & operations — reduce stockouts and dead stock at the same time.
- Small manufacturers — plan raw-material reorders around supplier lead times.
- Anyone using a spreadsheet to eyeball "are we low on this?"
Frequently asked questions
Is Excel Inventory Forecast free?
Yes — open-source under the MIT license, free for personal and commercial use.
What's the difference between reorder point and safety stock?
Safety stock is the buffer for unexpectedly high demand during lead time. The reorder point is that buffer plus the demand you expect during lead time — the level at which you place a new order.
What service level should I choose?
95% is a common default. Use higher (98–99%) for critical or high-margin items, lower (90%) for cheap, easily-replaced items. It's a cost-vs-stockout trade-off.
What data do I need?
A CSV of demand history with a SKU column and a units-sold column, plus your supplier lead time in days.
Point the tool at the columns with --sku-col and --units-col.
Does it handle multiple SKUs at once?
Yes — it computes safety stock and reorder point for every SKU in the file in a single run.
How is the safety factor calculated?
The tool converts your service level into a z-score using a standard inverse-normal approximation, so you never need a z-table.
Summary
Stockouts and overstock are the same problem seen from two sides — and both come from reordering by gut. Excel Inventory Forecast computes the correct safety stock and reorder point for every SKU from your own demand history, free and open-source. Download it, point it at your sales data, and reorder on evidence instead of instinct.