
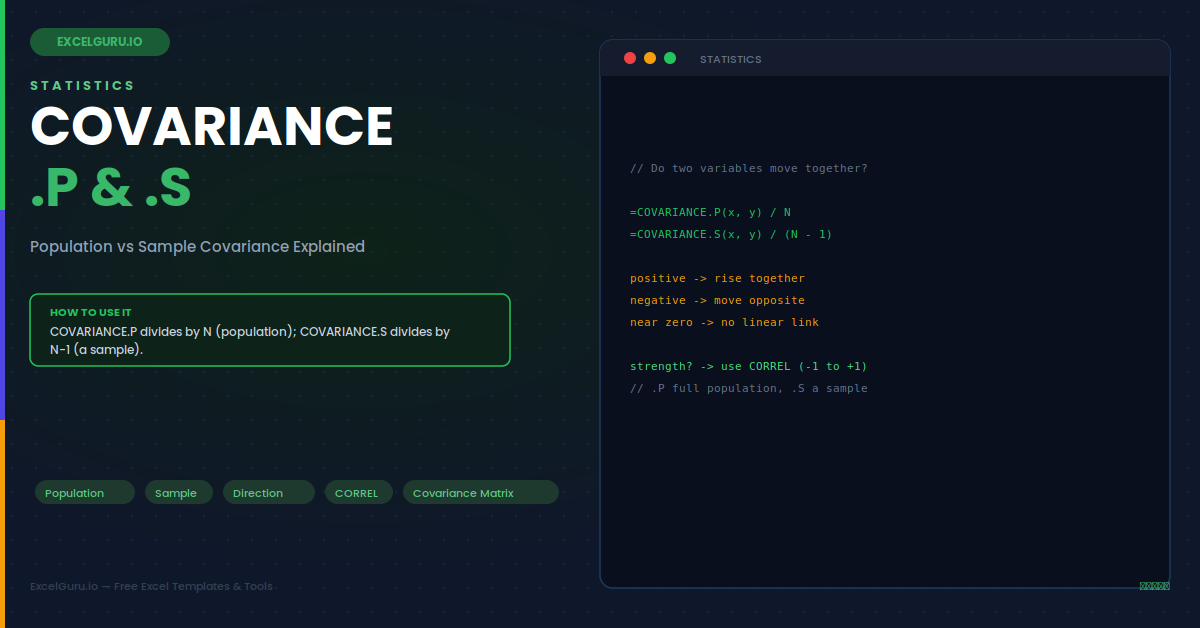
When advertising spend goes up, do sales follow? When temperature rises, does energy use climb with it? Questions like these ask whether two things move together. Covariance answers them with a single number. A positive value means they rise and fall together. A negative value means one climbs as the other drops. Excel gives you two versions for this. COVARIANCE.P works with a full population. COVARIANCE.S works with a sample. Knowing which to use keeps your analysis honest.
This guide explains covariance in plain terms. First, it shows what the sign and size mean. Then it covers the crucial difference between the population and sample versions. Seven worked examples and a full troubleshooting section follow. By the end, you will read covariance correctly and pick the right function every time.
What Covariance Measures
Covariance describes the direction of a relationship between two variables. It looks at how they vary around their own averages. When both tend to be above average together, covariance is positive. When one is high while the other is low, it is negative. The infographic below shows all three patterns at a glance.
The sign is the key message. A positive sign means the variables move in step. A negative sign means they move in opposite directions. A value near zero means there is no clear linear link. Notably, the size of the number is harder to read, which we address next. For now, focus on the sign, since it carries the clearest meaning.
Reading the Size (and Its Limits)
Covariance has one awkward feature. Notably, its size depends on the units of the data. Spend measured in dollars gives a very different number than spend in thousands. So you cannot compare covariance values across different datasets easily. This is its main limitation.
Population vs Sample: The Core Difference
The two functions differ in one small but vital way. COVARIANCE.P divides by the number of data points. COVARIANCE.S divides by that number minus one. This choice depends on whether your data is the whole population or just a sample of it.
The Syntax
Both functions take the same two arguments. Each argument is a range of numbers. The two ranges must be the same size. They should also line up point by point.
Example 1: A Simple Positive Covariance
Start with a clear case. Advertising spend and sales usually rise together. So you expect a positive covariance. Here is how to compute it.
Example 2: A Negative Covariance
Some pairs move in opposite directions. Price and demand often do. As price rises, quantity sold tends to fall. Therefore, their covariance is negative. This inverse pattern is common in economics.
Example 3: Population vs Sample on the Same Data
It helps to see the two functions side by side. On identical data, the sample version returns a slightly larger value. This is because it divides by a smaller number. The gap shrinks as the dataset grows.
Here the sample value is larger than the population value. With only a few points, the difference is clear. However, with hundreds of points, the two nearly match. This is why the choice matters most for small datasets. For large ones, either version gives almost the same answer.
Example 4: Choose the Right Version
However, the choice is not about preference. It is about what your data represents. Use the population version only when you have every possible data point. Use the sample version when your data is a subset drawn from something larger.
| Your data is... | Use |
|---|---|
| Every unit in the group (all 50 stores) | COVARIANCE.P |
| A sample from a larger group (200 of 10,000 customers) | COVARIANCE.S |
| Unsure, and generalising to a wider group | COVARIANCE.S |
Example 5: Covariance to Correlation
Remember, covariance tells you direction but not strength. To measure strength, convert it to correlation. You divide covariance by the two standard deviations. This scales the value to a range from minus 1 to plus 1.
Example 6: A Covariance Matrix for Several Variables
In practice, finance and analytics often need covariance between many variables. A covariance matrix holds every pair at once. You can build it with the Analysis ToolPak. It is central to portfolio risk models.
Example 7: Guard Against Mismatched Ranges
Covariance needs two equal-length ranges. A mismatch causes an error. A short check confirms the ranges line up before calculating. This keeps a shared workbook robust.
Troubleshooting Covariance Functions
All three problems below are the most common. Each has a clear cause and a quick fix.
You get a #N/A error
This error usually means the two ranges are different lengths. Both COVARIANCE.P and COVARIANCE.S need arrays with an equal number of values. Check that each range covers exactly the same number of rows. A common slip is selecting one extra cell in one range, such as a header or a trailing blank. Trim both ranges to the same data cells only. Once the two arrays match in length, the function returns a proper number instead of the error. Pairing each x value with its matching y value is essential.
The value seems huge or hard to interpret
A very large covariance is often not an error at all. Its size depends on the units of your data, so large numbers produce large covariances. This is exactly why covariance is hard to compare across datasets. If the raw number is not meaningful to you, convert it to correlation instead. Divide by the two standard deviations, or simply use CORREL, to get a value between minus 1 and plus 1. Correlation removes the unit problem and makes the strength of the relationship easy to read.
Two versions give different answers
A difference between COVARIANCE.P and COVARIANCE.S is expected, not a bug. The population version divides by N, while the sample version divides by N minus one. Because the sample version uses a smaller divisor, it always returns a slightly larger value on the same data. The gap is largest for small datasets and shrinks as the number of points grows. Choose the version that matches your data rather than expecting them to agree. Use the population version for a complete population, and the sample version for a sample.
Frequently Asked Questions
- What is the difference between COVARIANCE.P and COVARIANCE.S?+Both measure how two variables move together, but they use different divisors. Specifically, COVARIANCE.P divides the sum of products by N, the total number of data points, for a complete population where you have every observation. By contrast, COVARIANCE.S divides by N minus one, which corrects for the bias that arises when your data is only a sample of a larger group. Consequently, because it divides by a smaller number, the sample version returns a slightly larger value on the same data. The difference is noticeable for small datasets and becomes negligible as the number of points grows.
- Which covariance function should I use?+Use COVARIANCE.P only when your data represents the entire population, meaning you have every possible observation, such as all fifty stores in a chain. By contrast, use COVARIANCE.S when your data is a sample drawn from a larger group, such as two hundred surveyed customers out of thousands. In practice, most analysis works with samples and aims to generalise to a wider group, so the sample version is usually the safer choice. Therefore, if you are ever unsure whether your data is a full population or a sample, defaulting to COVARIANCE.S is the more conservative option.
- What does a positive or negative covariance mean?+The sign of covariance tells you the direction of the relationship between two variables. Specifically, a positive covariance means the two rise and fall together, so when one is above its average the other usually is too. By contrast, a negative covariance means they move in opposite directions, so when one is high the other tends to be low. A value near zero suggests no clear linear relationship between them. Overall, the sign is the reliable message, while the actual size is harder to interpret because it depends on the units.
- Should I use covariance or correlation?+Use covariance when you only need the direction of a relationship, and correlation when you need its strength on a comparable scale. Covariance has a drawback: its magnitude depends on the units of the data, so you cannot easily compare covariance values across different datasets. Fortunately, correlation solves this by dividing covariance by the two standard deviations, producing a value between minus 1 and plus 1. Specifically, in Excel CORREL gives you this directly. As a rule, reach for covariance in intermediate calculations like portfolio models, and correlation when you want an interpretable measure of how strongly two things relate.