
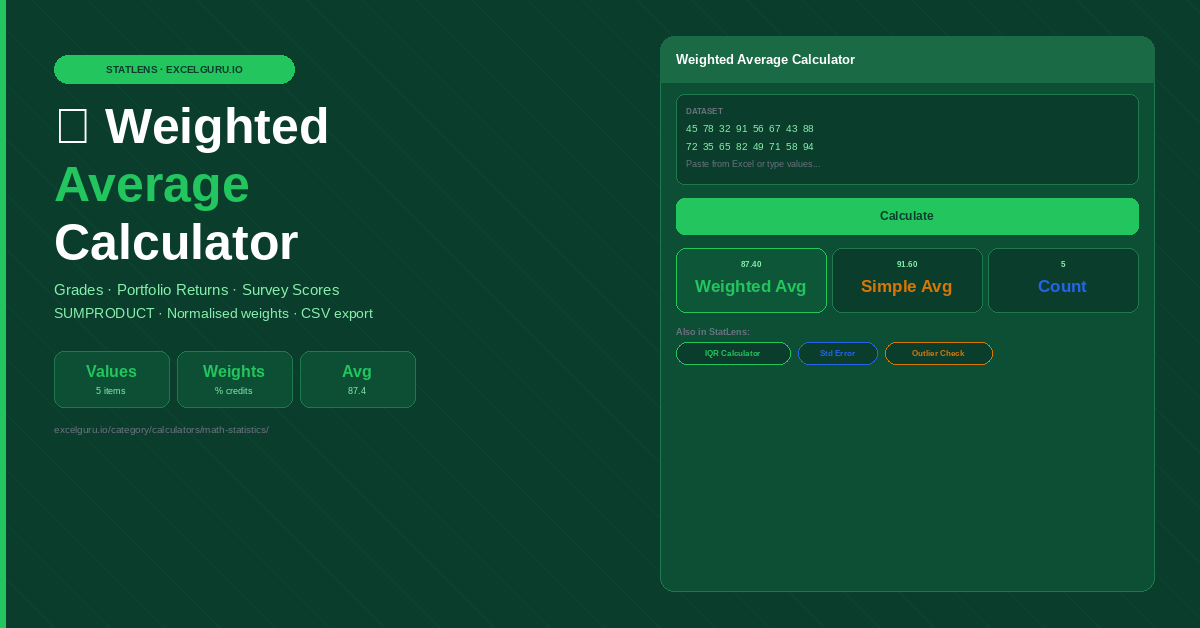
Paste your values and weights, then click Calculate. Weights can be percentages, credits, or any unit.
How to Use the Weighted Average Calculator
Calculate a weighted average from any dataset by assigning different importance to each value. Get the weighted mean, simple average for comparison, and a full per-item contribution breakdown by pasting two columns directly from Excel.
Enter values and weights
Type your values into the Values field — one per line or comma-separated. Enter the corresponding weights in the Weights field. Order matters: the first weight applies to the first value. Weights can be percentages, credit hours, unit quantities, importance scores, or any positive number. They do not need to sum to 100 or any specific total.
Calculate and review breakdown
Click Calculate to see the weighted average instantly. The breakdown table shows each value multiplied by its weight, the resulting product, and that item's percentage contribution to the total. This makes it easy to see which values are driving the average most significantly and to verify the calculation matches your expectations.
Compare with simple average and export
The results also show the simple (unweighted) average alongside the weighted average. When these two figures differ significantly, it confirms that weighting is having a meaningful effect. Download the full breakdown as a CSV for inclusion in grade reports, investment analysis, or quality dashboards.
Weights of 20, 25, 30 produce exactly the same weighted average as weights of 40, 50, 60 — the calculator divides by the total weight regardless of scale. This means you can use credit hours, percentage allocations, dollar amounts, priority scores, or any other unit that reflects relative importance. You never need to manually convert weights to percentages before calculating.
Weighted Average Formula, Applications, and Excel SUMPRODUCT
The weighted average formula, how it differs from a simple average, worked examples in education, finance, and inventory, the Excel SUMPRODUCT formula, and common mistakes to avoid.
The weighted average formula
A weighted average multiplies each value by its assigned weight, sums those products, then divides by the total weight. This gives proportionally more influence to values with larger weights — which is the entire point. When all weights are equal, the result equals the simple arithmetic average.
Worked examples across real use cases
Maths (4 credits, 90%), English (3 credits, 75%), Science (4 credits, 85%). Total credits = 11.
Asset A holds 40% of the portfolio with a 12% return. The second asset holds 60% of the portfolio with a 7% return.
Batch 1: 100 units at AED 25 each. The second batch totals 150 units purchased at AED 30 each. Total = 250 units.
Q1 rated 8/10 (weight 3). Q2 rated 6/10 (weight 2). Q3 rated 9/10 (weight 5). Total weight = 10.
Excel SUMPRODUCT formula for weighted average
Excel has no dedicated WEIGHTEDAVERAGE function, but SUMPRODUCT handles it cleanly in one formula. If values are in A2:A10 and weights are in B2:B10, use =SUMPRODUCT(A2:A10, B2:B10) / SUM(B2:B10). This works for any number of rows and any weight unit. SUMPRODUCT is far faster than manual multiplication row by row for GPA calculations with many courses and updates automatically when any grade or credit value changes.
Additionally, for a dashboard that shows both weighted and simple averages side by side, add =AVERAGE(A2:A10) in a neighbouring cell. When the two figures diverge significantly, it signals that the weighting scheme is having a material effect — which is exactly when weighted averaging is most valuable.
When to use weighted average vs simple average
Simple averages work when every item contributes equally to the outcome — for example, averaging the scores of four equally-weighted quiz questions. Weighted averages are necessary when items differ in size, duration, importance, or allocation. Returns averaged without weighting by portfolio allocation give a figure that does not reflect actual return. Costs averaged without unit-count weighting understates or overstates the true unit cost. Any time items are not genuinely equal, weight them.
Averaging two percentage growth rates without weighting by the base period produces a misleading result. A product grew 100% in January (from 10 to 20 units) and 5% in February (from 10,000 to 10,500 units). Without weighting, the average is 52.5% — describing neither month accurately. Weighting by base-period volume gives a result far closer to the February figure, which is where almost all the actual activity occurred. Always weight percentage rates by their corresponding base values.
Weighted average in inventory accounting (WAVG method)
In inventory accounting, the Weighted Average Cost (WAVG) method calculates a blended unit cost each time new stock arrives. It divides the total cost of goods available (opening stock cost + new purchases cost) by the total units available (opening units + new units purchased). This smooths out price fluctuations across multiple purchase batches and is one of the three main inventory costing methods alongside FIFO and LIFO.
Weighted average in finance — bond duration and portfolio returns
Portfolio managers use weighted averages constantly. The weighted average return of a portfolio weights each asset's return by its percentage allocation. Weighted average maturity of a bond portfolio weights each bond's maturity by its market value. Duration — a key bond risk measure — is a weighted average of the time to each cash flow, weighted by the present value of that cash flow. All of these use the same formula this calculator applies.
Frequently Asked Questions
Common questions about weighted average calculation, Excel formulas, and practical applications in grading, finance, and inventory.