
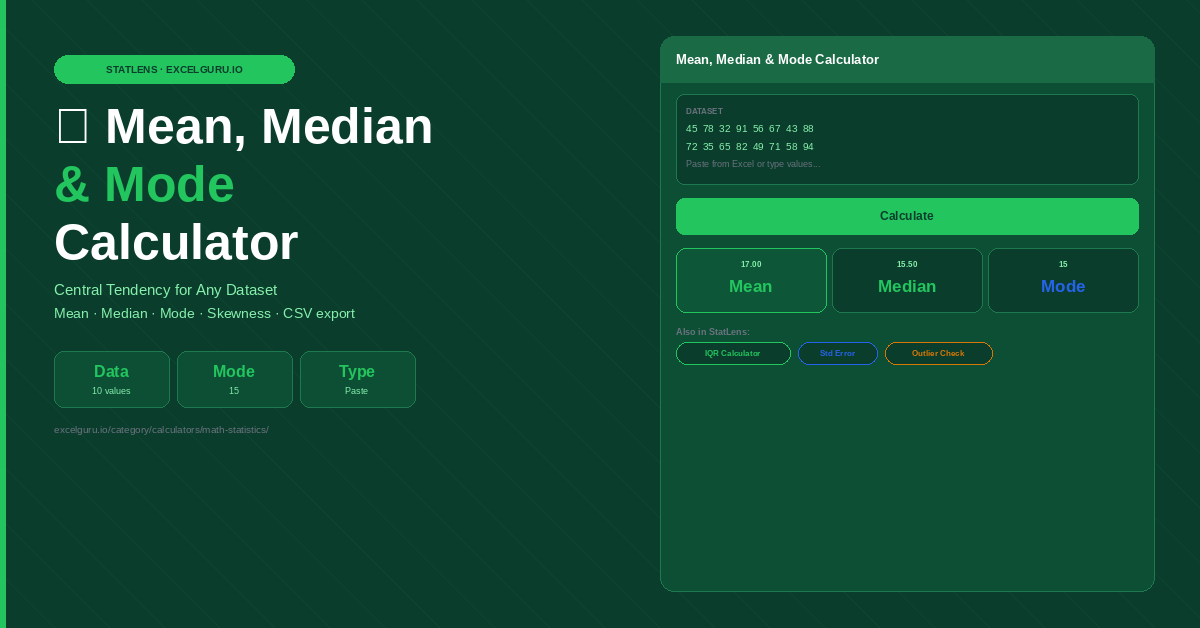
Enter or paste your dataset and click Calculate. Handles any numeric data including negatives and decimals.
How to Use the Mean, Median and Mode Calculator
Calculate all three measures of central tendency from any numeric dataset. Paste a column directly from Excel and get mean, median, mode, count, sum, min, max, range, and a skewness interpretation instantly.
Paste your dataset
Enter values in the dataset field — one per line, or separated by commas, spaces, or tabs. Paste directly from an Excel column by copying the cells and pasting into the field. The calculator handles any sample size from 2 values to several thousand. Decimals and negative numbers are fully supported.
Calculate and review results
Click Calculate to see mean, median, and mode alongside supporting statistics: count, sum, minimum, maximum, and range. All modes are shown when the dataset is bimodal or multimodal. When no value repeats, the tool correctly reports no mode rather than selecting an arbitrary value.
Read the skewness interpretation
The interpretation card compares mean to median to signal distribution shape. Roughly symmetric data shows mean and median very close together. Right skew appears when mean exceeds median — a few high values pull the average upward. The sorted dataset display at the bottom lets you verify the ordering and spot any data entry errors visually.
In a perfectly symmetric distribution, mean equals median equals mode. When they diverge, the distribution is skewed. A salary dataset where the mean is AED 85,000 but the median is AED 52,000 tells you that a small number of very high earners are inflating the average. Reporting the mean alone would give a misleading picture of typical pay. In that case, the median is the more honest summary.
Mean, Median, and Mode — Formulas, Differences, and When to Use Each
Three central tendency measures, their formulas, how skewness affects which one to report, what multimodal data signals, Excel functions for each, and real-world applications across HR, finance, and data analysis.
Mean — the arithmetic average
The mean sums all values and divides by the count. It is the most widely used measure of centre and works well for symmetric, normally distributed data. However, extreme values pull the mean away from the typical value. A single outlier — one executive salary, one fraudulent transaction, one measurement error — can shift the mean significantly while leaving the median almost unchanged.
Median — the middle value
Sorting all values from lowest to highest and selecting the middle value gives the median. For even-count datasets, the median is the average of the two central values. Outliers have no effect on the median — a dataset of [1, 2, 3, 4, 1000] has a median of 3 regardless of how large the outlier is. This robustness makes the median the preferred central summary for skewed distributions.
Mode — the most frequent value
Mode is the value appearing most often in the dataset. A dataset can be unimodal (one mode), bimodal (two modes), or multimodal (three or more modes). When every value appears exactly once, there is no mode. Mode is the only measure of central tendency applicable to categorical data — for example, the most common product category in a sales log, or the most frequent defect type in a quality audit.
Worked examples with interpretation
Scores: 4, 7, 9, 2, 7, 5, 7. Sorted: 2, 4, 5, 7, 7, 7, 9. n=7.
Values: 10, 20, 30, 40. Sorted: 10, 20, 30, 40. n=4, even.
Salaries: 30K, 32K, 35K, 34K, 38K, 150K. One executive earns 4× the others.
Scores: 55, 60, 60, 70, 80, 80, 90. Both 60 and 80 appear twice.
Skewness — what the gap between mean and median tells you
When mean exceeds median, more values are clustered at the low end with a long right tail pulling the mean upward — right skew (positive skew). This is common in income data, property prices, wait times, and claim amounts. When median exceeds mean, a few very low values are dragging the average down — left skew (negative skew), common in test scores near a maximum or battery lifetimes approaching end-of-life. Symmetric distributions have mean and median approximately equal.
A bimodal distribution — two modes — often signals that you are looking at two distinct populations mixed together. Employee satisfaction scores might be bimodal if half the workforce loves the culture and the other half is disengaged. Instead of reporting a single mean that represents neither group, split the dataset and analyse each population separately. The mode is your first clue that aggregation is hiding something important.
Excel functions for mean, median, and mode
Excel provides =AVERAGE(range) for the arithmetic mean, =MEDIAN(range) for the median, and =MODE(range) for the most frequent single value. For datasets with multiple modes, use =MODE.MULT(range) — enter it as an array formula with Ctrl+Shift+Enter in Excel 2016 or earlier, or simply press Enter in Excel 365 and Excel 2021, where dynamic arrays resolve automatically. All three functions ignore blank cells and text values, which makes them safe to use on mixed-content columns without pre-filtering.
When to report median instead of mean
Median is the right choice when data is skewed, contains outliers, or involves quantities that cannot have negative values but can be extremely large — income, housing prices, response times, claim amounts. Mean works when data is roughly symmetric, when you need to calculate further statistics (standard deviation, confidence intervals), or when every item genuinely contributes proportionally to the total. In many business reports, showing both alongside each other — with the gap between them flagged as a data quality signal — gives the most complete picture.
Frequently Asked Questions
Common questions about mean, median, mode, skewness, and choosing the right central tendency measure for your data.