
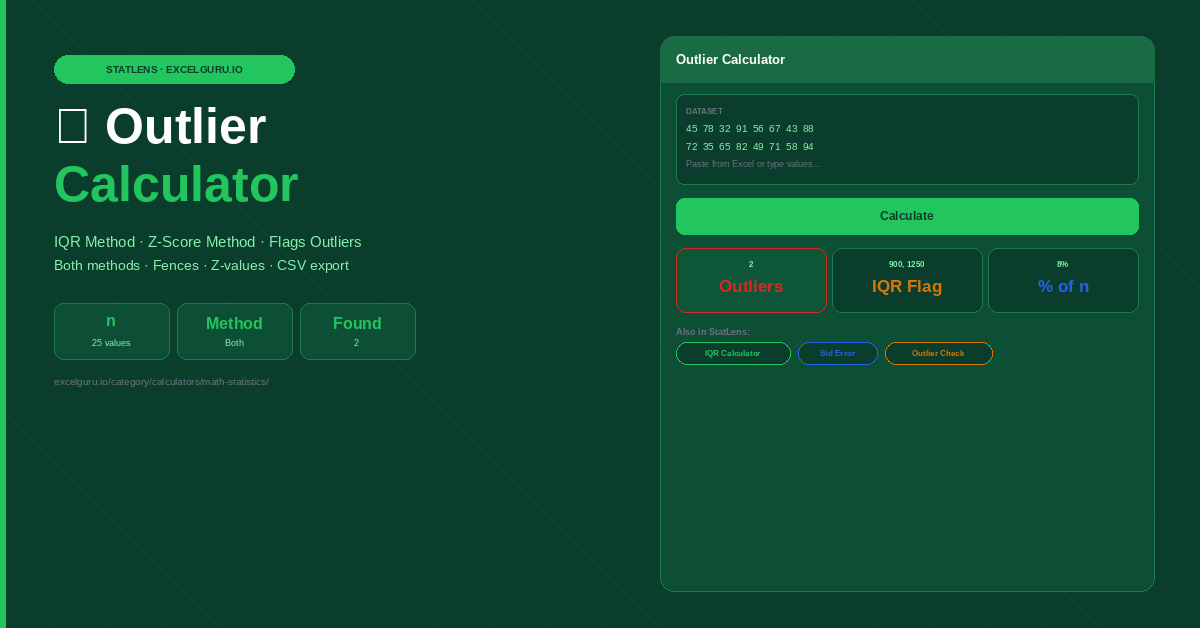
Enter your data and click Calculate.
How to Use the Outlier Calculator
Detect outliers in any numeric dataset using two standard statistical methods: the IQR fence method and the z-score method. Paste data directly from Excel and identify extreme values with full reference statistics in one click.
Paste your dataset
Enter numeric values by pasting an Excel column into the dataset field, or type values separated by commas or newlines. Both detection methods require at least 4 values for meaningful results. Large datasets of hundreds of values work equally well. The calculator sorts values and computes all reference statistics before applying the detection rules.
Choose a detection method
Select Both methods to apply IQR and z-score simultaneously and see which values each method flags. IQR only suits skewed data or datasets with suspected multiple outliers — IQR is more robust. Z-score only works best for normally distributed data where you want to flag values beyond 3 standard deviations from the mean.
Review and investigate flagged values
Results list each flagged value with the detection method and its z-score. Reference values — Q1, Q3, IQR, fences, mean, and SD — are shown so you can verify the detection logic. Before removing any flagged value, investigate whether it is a data entry error, a genuine extreme observation, or a measurement artefact. Download the CSV to document the outlier review in an audit trail.
A statistical outlier is simply a value far from the others by a defined criterion. It may be a genuine observation worth keeping, a data entry error to fix, or a measurement anomaly to exclude. Each case calls for a different response. Removing outliers without investigation biases results. Document every decision — which values you flagged, why you investigated them, and what action you took.
Outlier Detection Methods, the Masking Effect, and When to Remove Outliers
How IQR fences and z-scores work, key differences between the two methods, the masking problem when multiple outliers inflate standard deviation, and a decision framework for what to do with detected outliers.
The IQR fence method
The IQR method flags values below Q1 − 1.5×IQR (lower fence) or above Q3 + 1.5×IQR (upper fence). Quartiles underpin the IQR method — making it unaffected by the very outliers it targets. Even when several extreme values are present, Q1 and Q3 remain stable — making IQR the default method for general-purpose outlier detection, especially with skewed data.
The z-score method
The z-score method flags values more than 3 standard deviations from the mean. It works well for normally distributed data with few existing outliers. However, it has a critical weakness: outliers inflate both the mean and the standard deviation, making moderate outliers appear less extreme than they are. In a dataset of [100, 105, 110, 108, 112, 900], the outlier 900 inflates the SD so much that its own z-score is only about 2.0 — below the 3σ threshold. The IQR method correctly flags it.
Weights: 100, 105, 108, 110, 112, 900g. IQR flags 900. Z-score: z=2.04 — not flagged.
API times: 120, 125, 118, 130, 122, 5ms. The 5ms reading is suspiciously fast.
50 exam scores from a normal distribution. One student scored 18 on a test with mean 72 and SD 8.
Sales: 1,200, 1,350, 1,280, 1,310, 1,290, 1,330, 1,260. Consistent range.
Multiple outliers in the same direction can inflate the mean and standard deviation so severely that each individual outlier's z-score appears moderate. This is called masking — outliers hide each other. The IQR method is much less susceptible to masking because quartiles are not affected by the extreme values being tested. Always run both methods when multiple outliers are suspected, and treat IQR results as more reliable when they disagree.
Decision framework — what to do with flagged outliers
First, verify the data source. Check whether the flagged value was entered correctly — transcription errors, decimal point mistakes, and unit confusion account for a large share of statistical outliers in business data. Second, investigate the context. A sales figure of AED 2.4M in a dataset of mostly AED 40-80K entries might be correct — it could represent a large enterprise deal. Removing it would understate true revenue. Third, consider the analysis purpose. Excluding a genuine extreme observation with a footnote is defensible in a descriptive summary of typical values. A complete audit or fraud analysis requires it to stay.
Excel outlier detection with IQR
In Excel, flag outliers in a helper column using: =IF(OR(A2<QUARTILE.INC($A$2:$A$100,1)−1.5*(QUARTILE.INC($A$2:$A$100,3)−QUARTILE.INC($A$2:$A$100,1)), A2>QUARTILE.INC($A$2:$A$100,3)+1.5*(QUARTILE.INC($A$2:$A$100,3)−QUARTILE.INC($A$2:$A$100,1))), "OUTLIER", ""). Apply conditional formatting to highlight the OUTLIER cells in red. For z-score detection, use =ABS((A2−AVERAGE($A$2:$A$100))/STDEV($A$2:$A$100))>3.
Frequently Asked Questions
Common questions about outlier detection methods, when to remove outliers, the masking effect, and how outliers affect mean, median, and standard deviation.