
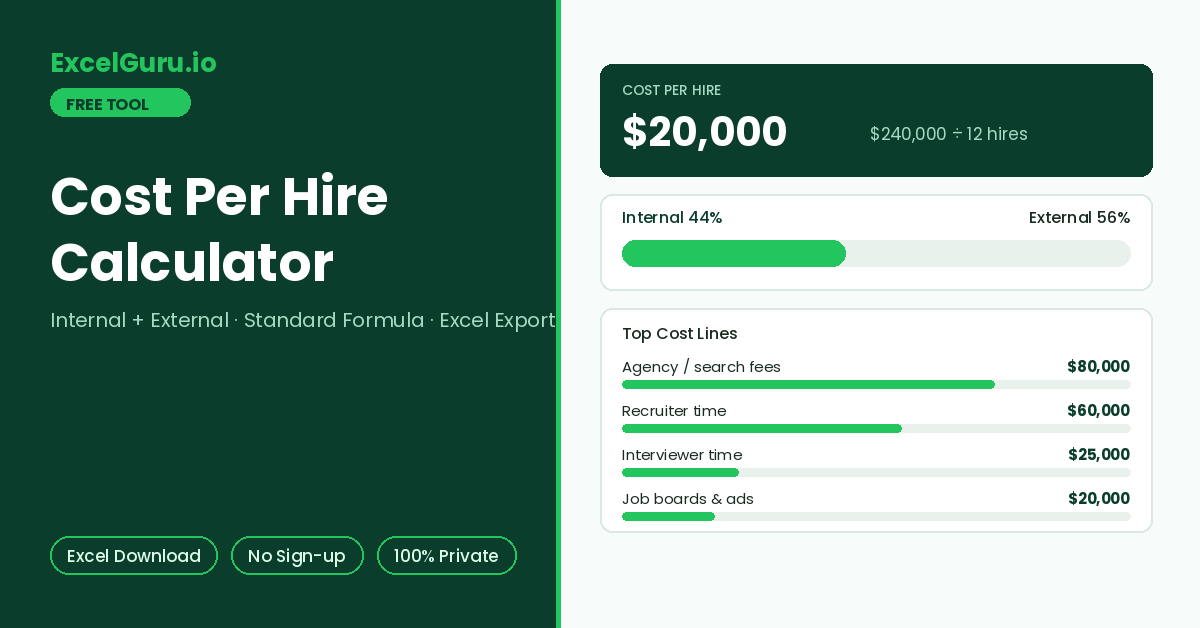
Cost per hire, the internal vs external split, and a category breakdown appear here.
How to Use the Cost Per Hire Calculator
Measure what recruiting actually costs per person hired, using the standard industry formula that sums internal and external costs and divides by hires. The category breakdown shows where the money goes, and the whole analysis downloads as an Excel file.
Gather costs for one period
Pick a period — a quarter or a year — and collect what recruiting consumed in it. Internal costs cover recruiter and interviewer time, referral bonuses, and admin. External costs cover job boards, agency fees, background checks, tools, and candidate travel.
Enter hires for the same period
Count every hire that started in the same window, across all sources. Mixing a quarter of costs with a year of hires is the most common way this metric goes wrong, so keep the windows identical.
Read the result and export
The result shows cost per hire, total spend, the internal versus external split, and each category as a share of total. Download the Excel file to keep the itemized record or feed a recruiting budget review.
Recruiter and interviewer time is usually the largest hidden cost. A quick estimate works: hours spent on hiring × loaded hourly rate (salary ÷ 2,080 × 1.3 for benefits). Six interviewers spending 4 hours each on one role at a $60 loaded rate adds $1,440 to that hire before any external spend.
Cost Per Hire Formula, Benchmarks, and What to Include
The standard CPH formula, internal versus external cost categories, commonly cited benchmarks, a worked example, and Excel formulas for your own data.
The standard cost per hire formula
Cost per hire is total recruiting spend divided by the number of hires in the same period. The widely adopted convention, standardised by SHRM and ANSI as a descriptive industry formula, splits spend into two buckets. Internal costs cover your people’s time and internal programs. External costs cover money paid to outside parties. Both halves matter: organisations that track only invoices typically understate true cost by a third or more.
What goes where
Widely cited industry surveys put average cost per hire in the low thousands of dollars for typical roles. Executive searches run many times higher — agency fees alone often reach 20–30% of first-year salary. Treat published averages as rough context only. Your own trend quarter over quarter is far more decision-useful than anyone else’s absolute number.
Worked example
A team makes 12 hires in a quarter. Internal costs: recruiter time 60,000, interviewer time 25,000, referral bonuses 15,000, admin 5,000 — totalling 105,000. External costs: job boards 20,000, agency fees 80,000, checks 8,000, tools 12,000, travel 10,000, events 5,000 — totalling 135,000. Cost per hire is (105,000 + 135,000) ÷ 12 = 20,000, split 44% internal and 56% external. The agency line alone is a third of total spend — exactly the kind of finding this breakdown exists to surface.
Keep one row per cost line with a Type column marked Internal or External. Then =SUMIF(TypeRange,"Internal",AmountRange) and the matching External SUMIF give the two subtotals, and =(InternalTotal+ExternalTotal)/Hires is the CPH. Category share is =Amount/TotalSpend formatted as a percentage. The downloaded Excel file arrives with this exact structure prefilled with your numbers.
Using CPH without being misled by it
A falling CPH is not automatically good news — cutting agency spend can lower CPH while stretching time-to-fill and pushing hidden costs onto hiring managers. Read CPH alongside time-to-fill and quality-of-hire indicators such as 90-day retention. Additionally, segment before comparing: engineering hires, frontline hires, and executive hires have structurally different costs, and one blended number across them hides more than it reveals.
Organisations differ on edge cases: onboarding costs, employer branding, and internal transfers may sit in or out of scope. Any choice works as long as it stays consistent across periods, because the value of CPH is the trend. Document the scope in the notes column of the exported file so future comparisons use the same rules.
Frequently Asked Questions
Common questions about the cost per hire formula, scope decisions, benchmarks, and the Excel export.