
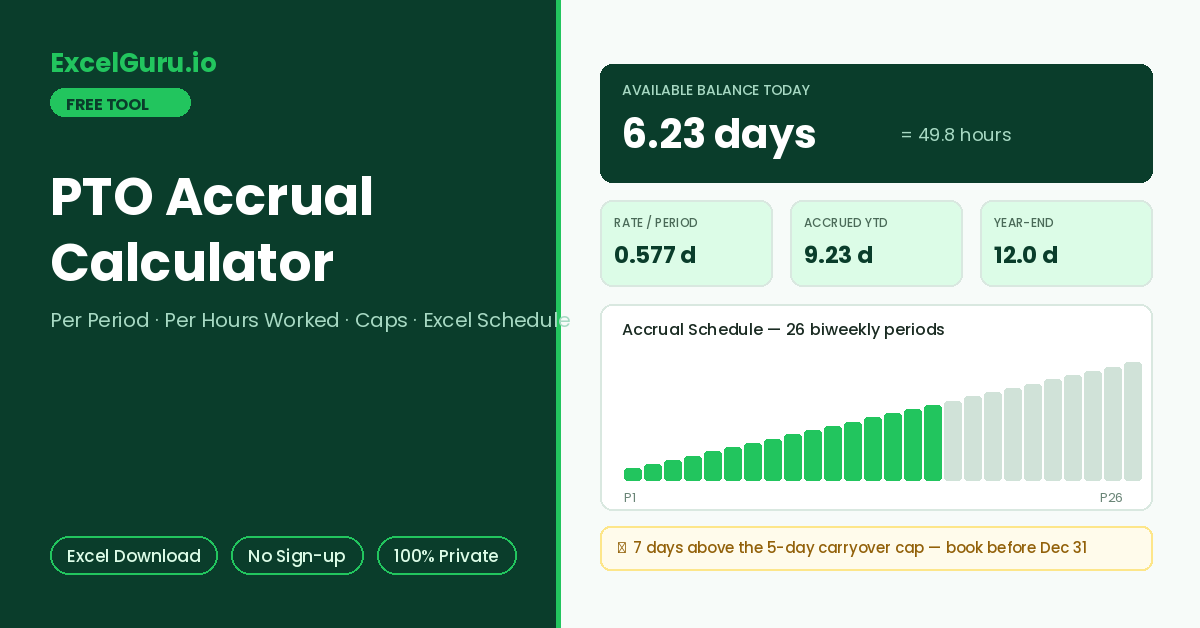
Current balance, accrual rate, year-end projection, and a period-by-period schedule appear here.
How to Use the PTO Accrual Calculator
Work out exactly how much paid time off you have earned so far. See your accrual rate per period or per hour, plus the projected year-end balance with carryover caps applied. The full accrual schedule downloads as an Excel file.
Pick the accrual method
Per Pay Period spreads the annual allowance evenly across your pay cycle — the most common salaried setup. Meanwhile, Per Hours Worked earns PTO in proportion to actual hours, the standard approach for hourly and part-time staff.
Enter allowance and progress
Type the annual PTO days, pay frequency, and completed pay periods (or hours worked so far). Add any carryover days from last year and the days already used this year.
Read the balance and export
Results show the accrual rate, days earned to date, current available balance, and the year-end projection with your carryover cap applied. Download the Excel schedule to see the balance after every pay period.
A 15-day allowance with a 5-day carryover cap means anything above 5 unused days vanishes on 31 December. The year-end projection in this tool flags exactly how many days sit above your cap, so you can plan leave before forfeiting it. Booking those days early beats losing them.
PTO Accrual Methods, Formulas, and Balance Math
The accrual formulas behind each method, typical rates by pay frequency, carryover cap logic, a worked example, and Excel formulas for tracking balances.
The two standard accrual formulas
Per-period accrual divides the annual allowance by the number of pay periods, crediting an equal slice each payday. Hours-based accrual instead defines a rate per hour worked, using the standard 2,080-hour work year (40 hours × 52 weeks) as the denominator. Both arrive at the same annual total for a full-time schedule. The difference shows up for part-timers and joiners, where hours-based accrual scales automatically.
Accrual per period at common allowances
Semimonthly schedules produce tidy numbers because 24 divides most allowances cleanly. Biweekly schedules produce repeating decimals. For this reason, payroll systems track PTO in hours rather than days — 4.62 hours per period is easier to audit than 0.577 days.
Worked example — 15 days, biweekly, 16 periods in
The rate is 15 ÷ 26 = 0.577 days per period. After 16 completed periods, accrued PTO is 0.577 × 16 = 9.23 days. With 3 days carried over and 6 days used, the available balance is 3 + 9.23 − 6 = 6.23 days. Projected year-end balance is 3 + 15 − 6 = 12 days; against a 5-day carryover cap, 7 days would be forfeited if untouched.
Rate per period is =AnnualDays/Periods. Accrued to date is =Rate*PeriodsElapsed, and the running balance is =Carryover+Accrued-Used. To apply a carryover cap at year end, use =MIN(YearEndBalance,Cap), and the forfeited amount is =MAX(0,YearEndBalance-Cap). The downloaded schedule sheet applies these row by row for every pay period.
Accrual timing details that change balances
Policies differ on when a period’s accrual lands — on the first day of the period, the last day, or the payday itself. End-of-period crediting is most common, which is why this tool counts completed periods only. Additionally, many employers pause accrual during unpaid leave, and some front-load the entire allowance on 1 January instead of accruing at all. Front-loaded policies skip the schedule entirely: the balance is simply allowance plus carryover minus used.
Waiting periods, probation accrual, negative balance rules, and exit payout of unused PTO all vary by employer and local law. Some US states treat accrued PTO as earned wages that cannot be forfeited, which overrides use-it-or-lose-it caps. Use this calculator for planning, and confirm official balances against your HR system or policy handbook.
Frequently Asked Questions
Common questions about PTO accrual rates, caps, proration, and the Excel schedule.