
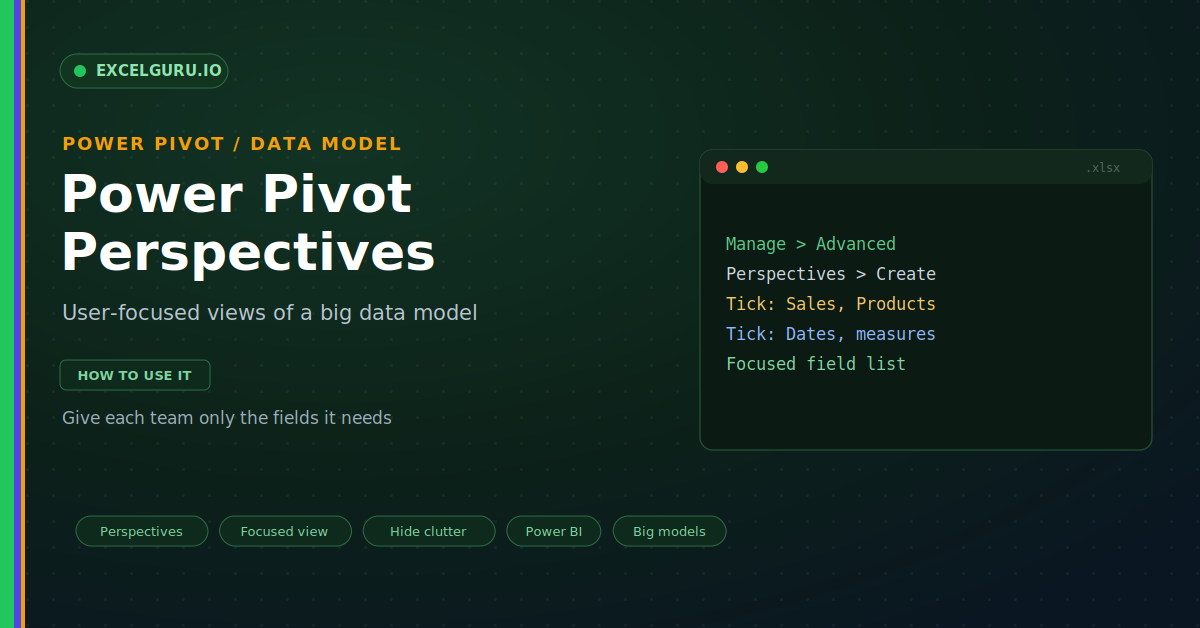
A rich data model is a gift and a burden. It holds many tables, columns, and measures. Yet that same richness overwhelms the field list. A sales user opens a PivotTable and sees ledger accounts, budgets, and payroll. As a result, they scroll and hunt for the few fields they need. Perspectives fix this. A perspective is a saved, focused view of the model that shows only the fields one audience cares about.
This guide shows how to build and use perspectives in Power Pivot. First, it explains what a perspective is and is not. Then it walks through creating views for sales and finance. Real examples and a full troubleshooting section follow. By the end, you will hand each team a clean, focused model.
What a Perspective Really Is
Think of a perspective as a lens over the model. The full model stays whole underneath. The lens simply shows a chosen subset of it. Notably, it is a display view, not a security wall. The infographic below makes the idea clear.
Each perspective names the tables, columns, and measures to show. A sales view might reveal Sales, Products, and Dates. A finance view might reveal GL, Budget, and Dates instead. Therefore each team sees only its own corner of the model.
Where Perspectives Live
Perspectives sit in the Power Pivot window, not the grid. You open that window from the Power Pivot tab. Then you switch on the Advanced tab to reach them. Because of this, many users never notice the feature.
Example 1: Create a Sales Perspective
Start with the team that needs the fewest fields. A sales user wants orders, products, and dates. So you build a view with just those. Everything else stays hidden from them.
Example 2: Add a Finance Perspective
A finance user needs a different slice. They care about the ledger, budgets, and dates. Instead of editing the sales view, you add a second one. Thus each team gets its own lens.
Example 3: Browse a Perspective in Power BI
Perspectives shine when the model is shared. Power BI and Analyze in Excel can pick a perspective by name. Then the connected report shows only that view. This is where the feature pays off most.
Example 4: Declutter Inside Excel with Hiding
Inside plain Excel, perspectives help less directly. For a quick tidy, hiding works better here. You can hide any column or table from client tools. Then it vanishes from the field list.
Example 5: Edit or Remove a Perspective
Models grow, so views need upkeep. A new measure may belong in the sales view. Fortunately, editing a perspective takes seconds. You simply tick or untick fields again.
Troubleshooting Perspectives
All three issues below come up often. Each has a clear cause and a quick fix.
The Perspectives button is greyed out
This means the Advanced tab is still hidden. Perspectives live only on that tab, so you must switch it on first. Open the Power Pivot window, then the File menu. Next, choose Switch to Advanced Mode. The Advanced tab now appears with the Perspectives command. If it still looks inactive, confirm your Excel edition includes Power Pivot. Some editions omit the add-in entirely.
A user still sees hidden tables
Remember that a perspective only trims the view. It does not block access to the data underneath. Therefore a user on a different view can still reach those tables. For real limits, apply row-level security in Power BI or Analysis Services. That layer filters the actual rows, not just the field list. In short, treat perspectives as tidying, never as protection.
A new measure is missing from a view
Perspectives do not update themselves when the model grows. So a fresh measure stays out of every existing view. To fix it, open the perspective and tick the new measure. Then save and refresh the connected report. As a habit, review each view after you add fields. This keeps every team's lens complete and current.
Frequently Asked Questions
- Are Power Pivot perspectives a security feature?+No, perspectives only tidy the field list. They hide tables and measures from a view. However, the data stays reachable through other views. For real access limits, use row-level security instead.
- Where do I create a perspective?+First, open the Power Pivot window from the Manage button. Then switch to Advanced Mode under the File menu. Finally, the Advanced tab shows the Perspectives command. From there you create and edit each view.
- Do perspectives work fully inside Excel?+Partly, because Excel uses them in a limited way. They shine most when Power BI or a connection consumes the model. Inside plain Excel, Hide from Client Tools often declutters faster. So combine both for the cleanest field list.
- Can one model hold several perspectives?+Yes, you can create as many as you need. For example, a sales view and a finance view can coexist. Each names its own tables and measures. Therefore every team gets a focused lens.