
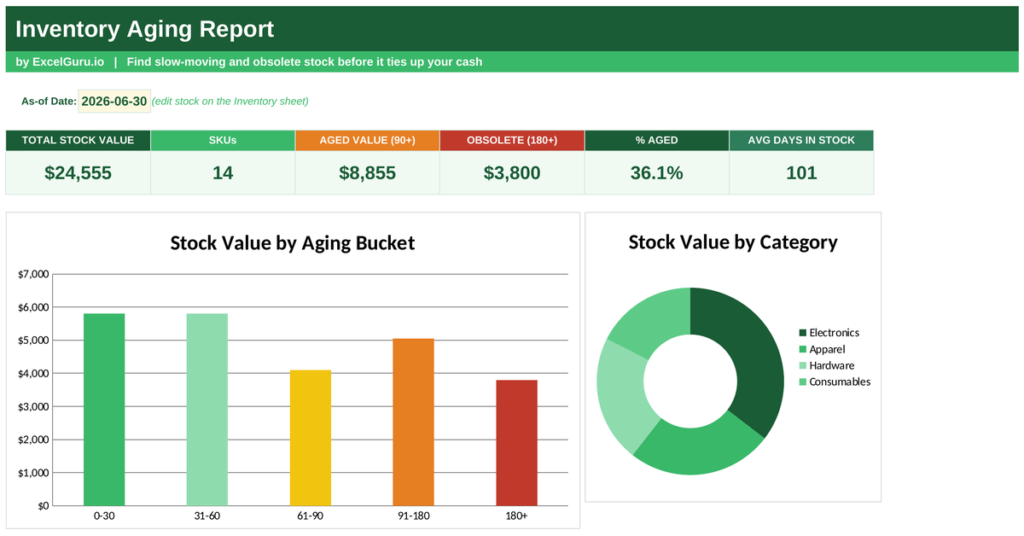
Stock that sits on the shelf too long quietly turns from an asset into a liability. It ties up cash, fills space, and risks becoming obsolete before it ever sells. An inventory aging Dashboard reveals exactly how long each item has been sitting, so you can act before slow stock becomes dead stock. This free Excel template values every item, sorts it into age buckets, and flags the stock at real risk. Below you will learn what inventory aging is, the formula behind it, and how the Dashboard builds every bucket.
Also, check out Inventory Ageing report template with minimal update features and simple dashboard.
What is inventory aging?
Inventory aging measures how long each item has been sitting in stock without selling. It groups your stock into age buckets, from fresh arrivals to items that have lingered for months.
The buckets usually run from 0-30 days through 31-60, 61-90 and 91-180, up to 180 days and beyond. The pattern is simple: the older an item, the more worrying it becomes. Fresh stock is healthy, but items past 180 days often signal money frozen on the shelf. So an inventory aging Dashboard turns a flat stock list into a clear picture of what is moving and what is stuck.
Why inventory aging matters
Old stock is expensive in ways a stock count never shows. Every item sitting unsold carries hidden costs.
It ties up cash you could spend elsewhere, and it fills warehouse space you pay for. Worse, it risks going obsolete, expiring or falling out of fashion, until you must discount it heavily or write it off. Because these losses build slowly, they hide until they hurt. So you need stock split by age, not rolled into one total, to catch slow movers before they become dead stock.
The inventory aging formula
The Dashboard rests on two simple calculations for every item. First you value it, then you age it.
Stock value = Quantity × Unit cost
Days in stock = As-of date − Date received
Bucket: 0-30, 31-60, 61-90, 91-180, or 180+ days
So you first multiply each item’s quantity by its unit cost to find its value. Then you work out its age, by subtracting the date it arrived from your as-of date. Finally the age drops the item into a bucket. The further past its arrival, the higher the bucket. So a single date subtraction, repeated for every item, drives the whole Dashboard.
How the template builds the aging Dashboard
The template needs your items with their quantity, unit cost and date received, plus one as-of date. From there it ages everything for you.
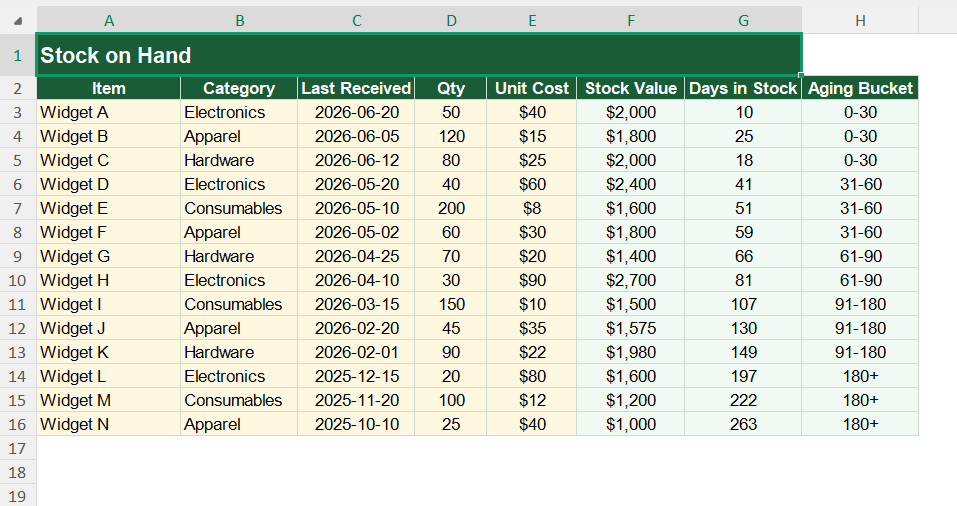
- Stock value appears in Column F as =D3*E3, the quantity times the unit cost.
- Days in stock use =Dashboard!$B$5-C3, the as-of date minus the received date.
- The bucket uses a nested check, =IF(G3<=30,”0-30″,IF(G3<=60,”31-60″,IF(G3<=90,”61-90″,IF(G3<=180,”91-180″,”180+”)))).
- The dashboard then totals each bucket with SUMIF, and works out aged stock as the value in the two oldest buckets.
- So changing the as-of date re-ages your whole inventory at once.
A worked aging example
Put a date on it and the logic is clear. Suppose you Dashboard as of 30 June, and 50 units of an item costing 30 each arrived on 1 March.
The stock value is 50 times 30, or 1,500. The days in stock are the days from 1 March to 30 June, which is 121. Because 121 falls between 91 and 180, the item lands in the 91-180 bucket and counts as aged stock. So it flags itself as a slow mover worth investigating before it ages further.
Reading the charts
The first chart shows stock value in each age bucket. Bars run from fresh on the left to 180-plus on the right, so the balance of your stock is instant.
A tall bar on the right warns that too much value is stuck in old stock. The second chart is a doughnut that splits value by category, showing where the aging concentrates. Because you see the age and the category together, you know exactly where to act. So together the charts turn a stock list into a plan to clear slow movers.
Attack the oldest bucket first. Stock past 180 days is the least likely to sell at full price, so a clearance or promotion there frees the most trapped cash.
Who uses an inventory aging Dashboard
Inventory and warehouse managers use it to spot slow and dead stock. It shows them what to clear before it loses value.
Retailers use it to plan markdowns on ageing lines. Finance teams use it to flag write-off risk. Small businesses use it to keep cash from freezing on the shelf. Because every business holding stock faces ageing, the Dashboard suits many settings.
Making the template your own
The template is a starting point, not a fixed form. You can add items as your catalogue grows. You can change the bucket ranges to match your own stock cycle.
The dashboard bends to your needs, so you can add a shelf-life or expiry column for perishable goods. A quick edit does it. You might also flag items for clearance once they pass a certain age. The structure welcomes that kind of extension without complaint.
Stock that never moves is money you cannot spend. An inventory aging Dashboard shows how long every item has sat and how much value is stuck, so you can clear slow movers before they become losses. So download the template, enter your stock, and turn a quiet warehouse problem into a clear plan of action.