
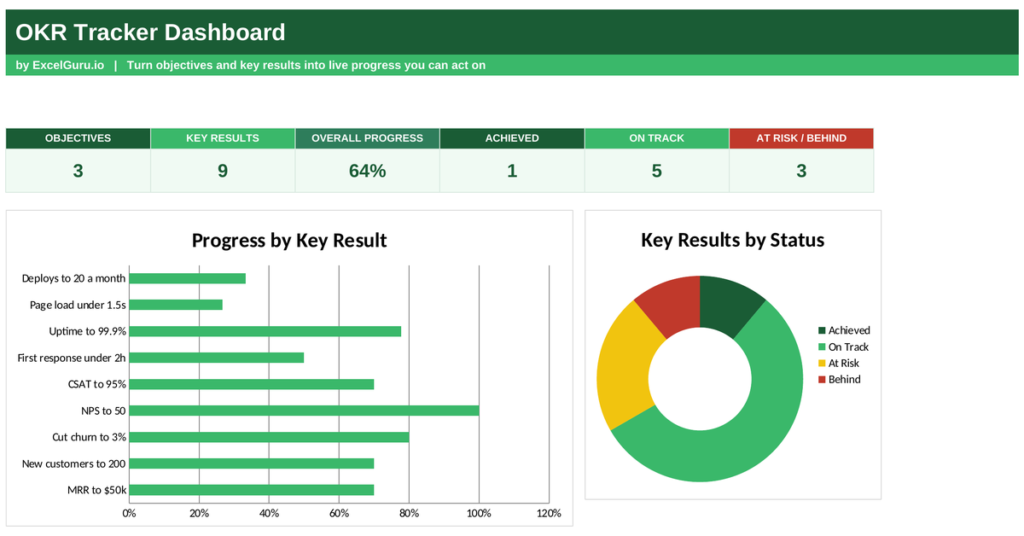
Ambitious goals mean nothing if nobody measures the progress toward them. Teams set bold targets in January and quietly lose track of them by March. An OKR tracker keeps every goal honest, scoring real progress against a clear target. This free Excel template measures each key result from its baseline to its target, flags what is on track, and rolls it all into one view. Below you will learn what OKRs are, the scoring formula, and how the tracker calculates progress.
What is an OKR tracker?
OKR stands for Objectives and Key Results, a goal-setting framework made famous at Intel and later Google. An OKR tracker is the tool that measures progress against those goals.
An objective is the qualitative goal you want to reach, such as delighting your customers. Key results are the measurable outcomes that prove you got there, each with a number to hit. Because objectives inspire while key results measure, the two work together. So an OKR tracker turns lofty ambitions into hard numbers you can actually watch move.
The OKR scoring formula
Each key result runs from a starting point to a target. Progress measures how far along that journey you have travelled.
Progress = (Current − Start) ÷ (Target − Start), held between 0 and 100%
Status: 100% Achieved, 70%+ On Track, 30%+ At Risk, below 30% Behind
So you measure progress relative to the baseline, not from zero. If a key result starts at 100, targets 200, and currently sits at 170, then progress is (170 − 100) ÷ (200 − 100), or 70%. This baseline approach handles goals that go up or down equally well. The progress then sets a status, from achieved through on track to at risk and behind. So a stretch goal and a reduction goal both score fairly.
How the OKR tracker calculates progress
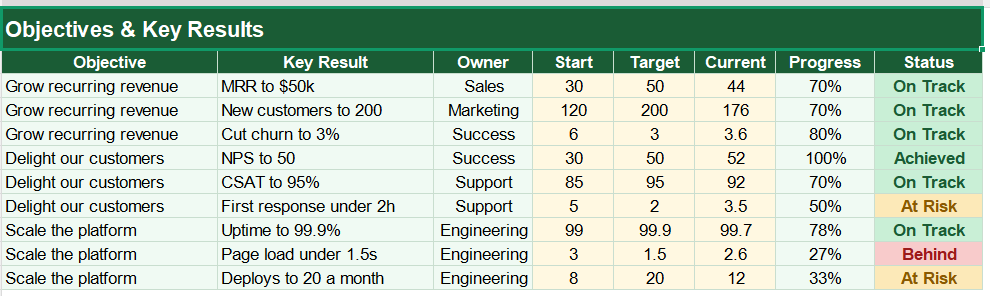
The tracker asks for each key result with its baseline, its target and its current value. From there it scores everything for you.
Progress appears as =MAX(0,MIN(1,(F3-D3)/(E3-D3))), the current-minus-start over target-minus-start, clamped between 0 and 100%. The status uses =IF(G3>=1,”Achieved”,IF(G3>=0.7,”On Track”,IF(G3>=0.3,”At Risk”,”Behind”))). Each objective’s score uses AVERAGEIF across its own key results, while the overall progress uses AVERAGE. The dashboard counts each status with COUNTIF. So every figure updates the moment you enter a new current value.
A worked OKR example
Follow one key result and the maths is clear. Suppose the goal is to raise a satisfaction score, which started the quarter at 70 and targets 90.
The team has reached 84 so far. Progress is (84 − 70) ÷ (90 − 70), which is 14 ÷ 20, or 70%. Because that hits the 70% mark, the status reads on track. Averaged with the other key results under its objective, it sets the objective’s overall score. So a single measure flows straight up into the headline progress.
Reading the charts
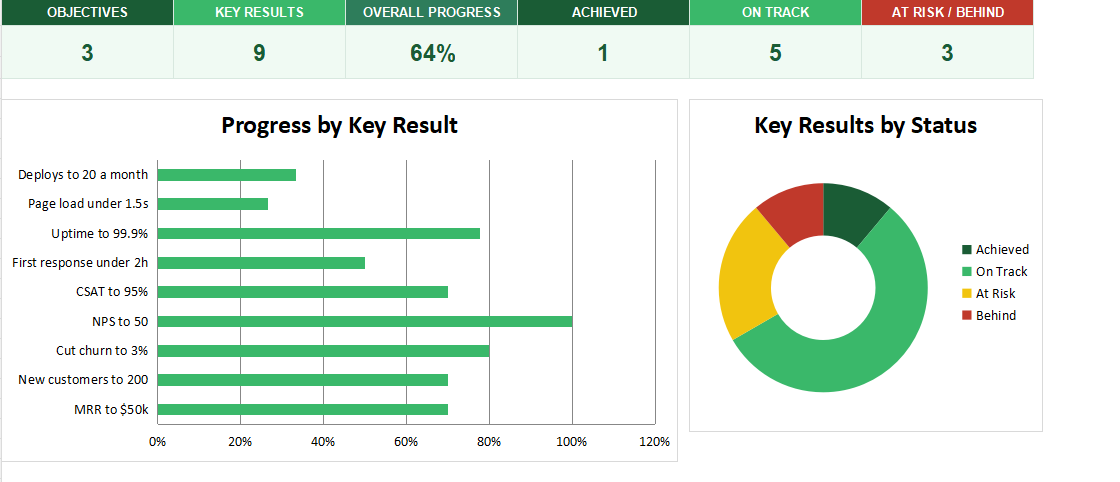
The first chart shows progress for every key result as a bar. Long bars mark the goals nearing completion, so the leaders and laggards are clear.
The second chart is a doughnut that splits key results by status. A wide achieved-and-on-track slice means a healthy quarter, while a large behind slice sounds a warning. Because you see individual progress and the overall status together, priorities become obvious. So together the charts show both how far each goal has come and how the whole set is tracking.
Set targets that stretch the team without breaking it. Good OKRs sit just beyond comfortable reach, so hitting around 70% often counts as strong progress rather than failure.
Who uses an OKR tracker
Founders and executives use it to align the whole company behind a few clear goals. It keeps everyone pulling the same way.
Team leads use it to track their quarter’s key results. Project managers use it to link daily work to strategic aims. Growing start-ups use it to stay focused as they scale. Because any team with goals can benefit, the tracker suits many settings.
Making the template your own
The template is a starting point, not a fixed form. You can add objectives and key results as your plans grow. You can change the status thresholds to be stricter or gentler.
The dashboard bends to your needs, so you can add an owner to each key result for clear accountability. A quick edit does it. You might also track progress week by week to catch a slipping goal early. The structure welcomes that kind of extension without complaint.
Bold goals only work when you can watch them move. An OKR tracker scores every key result against its baseline and target, so progress is never a mystery. So download the template, enter your goals, and turn a quarter of ambition into numbers you can steer by.
OKRs versus KPIs
People often confuse OKRs with KPIs, yet the two play different roles. Knowing the difference keeps your goals sharp.
A KPI is an ongoing health metric you monitor, such as monthly revenue or churn. An OKR is a time-boxed goal that pushes you to change something, usually within a quarter. So a KPI tells you how the business is running, while an OKR drives it somewhere new. Many teams watch their KPIs on a steady dashboard and set OKRs to move the ones that need to improve. Because OKRs are meant to stretch you, they often aim higher than a KPI target would. So the two work best side by side, one measuring the engine and the other steering it.