
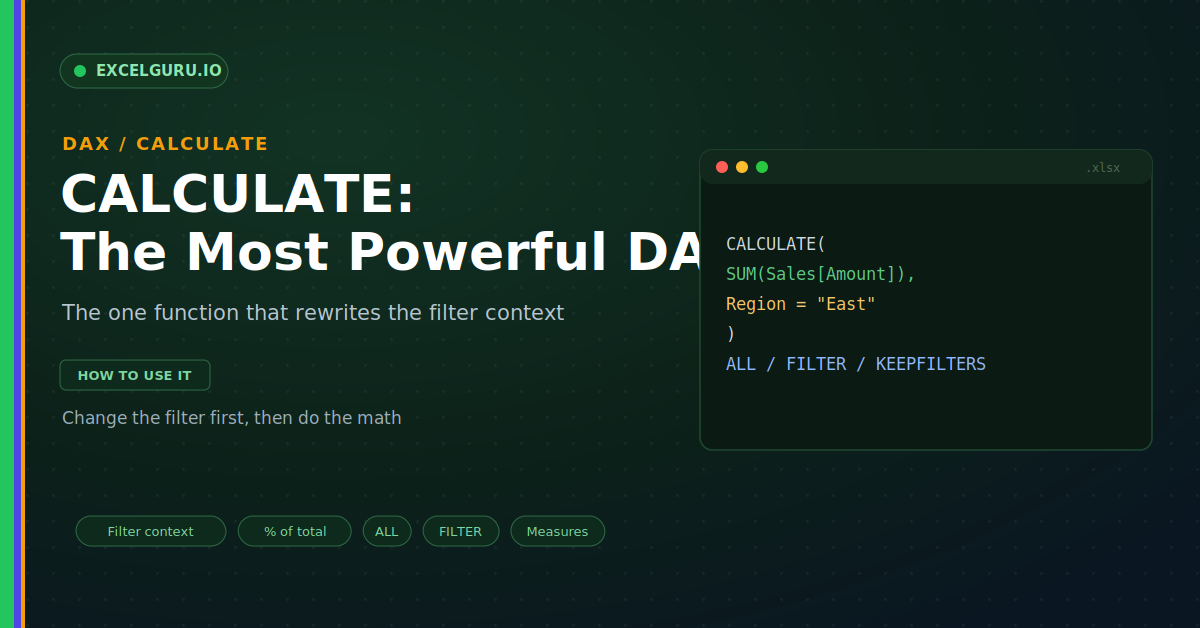
Most DAX formulas answer the question the pivot asks. A plain SUM adds up whatever the current row and slicer allow. That is fine, until you need something the pivot is not showing. You may want the share of the grand total, or sales for one region no matter the row. A plain sum cannot do that. CALCULATE can, because it is the one function that changes the filter itself.
This guide makes CALCULATE click, step by step. First, it explains what the function really does. Then it covers filter context, the syntax, and clear examples. Real formulas and a full troubleshooting section follow. By the end, you will bend the filter to your will.
What CALCULATE Does
CALCULATE runs a calculation under new rules. It changes the filter first, then does the math. So the same measure can return a different answer. The infographic below shows that two-step idea.
This is what makes CALCULATE unique. No other function can rewrite the filter context. Because of that, it powers most advanced measures. In practice, you will reach for it constantly.
Filter Context in One Minute
Filter context is simply what the cell is filtered by. A pivot cell for East shows only East rows. That set of filters is the context. CALCULATE steps in and edits that context.
The Syntax
The syntax is short and easy to read. First comes the expression to compute. After that come one or more filters. The filters run first, as shown below.
Example 1: Sales for One Region
Start with the simplest useful case. You want sales for East, whatever the row says. A single filter forces that region. As a result, the number ignores the row and shows East, as below.
Example 2: Percent of Total With ALL
A share needs the total to divide by. ALL removes filters to give that grand total. Then you divide the row value by it. Consequently, each row shows its percent of everything.
Example 3: Ignore a Slicer
Sometimes a measure must ignore the slicer. Perhaps you always want the full-year figure. ALL on that column releases its filter. Therefore the number holds steady as users click.
Handy Filter Modifiers
A few helpers make CALCULATE even stronger. Each shapes the filter in a different way. You will meet them again and again. So it helps to know them early.
Troubleshooting CALCULATE
All three problems below are the most common. Each has a clear cause and a quick fix.
The result matches the plain measure
This means your filter is not really biting. Often the pivot already filters to the same thing. For instance, a row of East plus a filter for East look identical. First, test the measure in a neutral cell, like a grand total. Then check that the filter column and value are spelled correctly. A tiny typo in the value quietly matches nothing. Once the filter differs from the pivot, the numbers separate.
Percent of total gives the wrong base
A wrong base usually comes from the ALL scope. ALL on one column clears only that column. ALL on the whole table clears everything instead. First, decide what "total" should mean for your report. Then match the ALL scope to that meaning. For a share of the grand total, use ALL on the table. For a share within a category, clear only the right column.
A measure behaves oddly in a calculated column
This points to something called context transition. Inside a row, CALCULATE turns the row into a filter. So a measure in a calculated column can surprise you. First, ask whether you truly need a column here. Often a measure is the better and safer choice. If you must use a column, test a few rows by hand. That check confirms the context behaves as you expect.
Frequently Asked Questions
- What does the DAX CALCULATE function do?+It runs an expression under a changed filter context. First it applies your filters, then it does the math. Notably, it is the only function that edits the context. So it powers most advanced measures.
- What is filter context in DAX?+It is the set of filters acting on a cell. The row, column, and slicer all add filters. A measure then sums only what they allow. So CALCULATE works by editing that set.
- How do I calculate percent of total with CALCULATE?+Divide the value by a total that ignores the row. Wrap the total in CALCULATE with ALL on the table. ALL removes the filters, giving the grand total. Then DIVIDE handles the fraction safely.
- What is the difference between ALL and FILTER?+ALL removes filters from a column or table. FILTER instead builds a new row-by-row condition. So use ALL to clear context and FILTER to add logic. Together they cover most needs.