
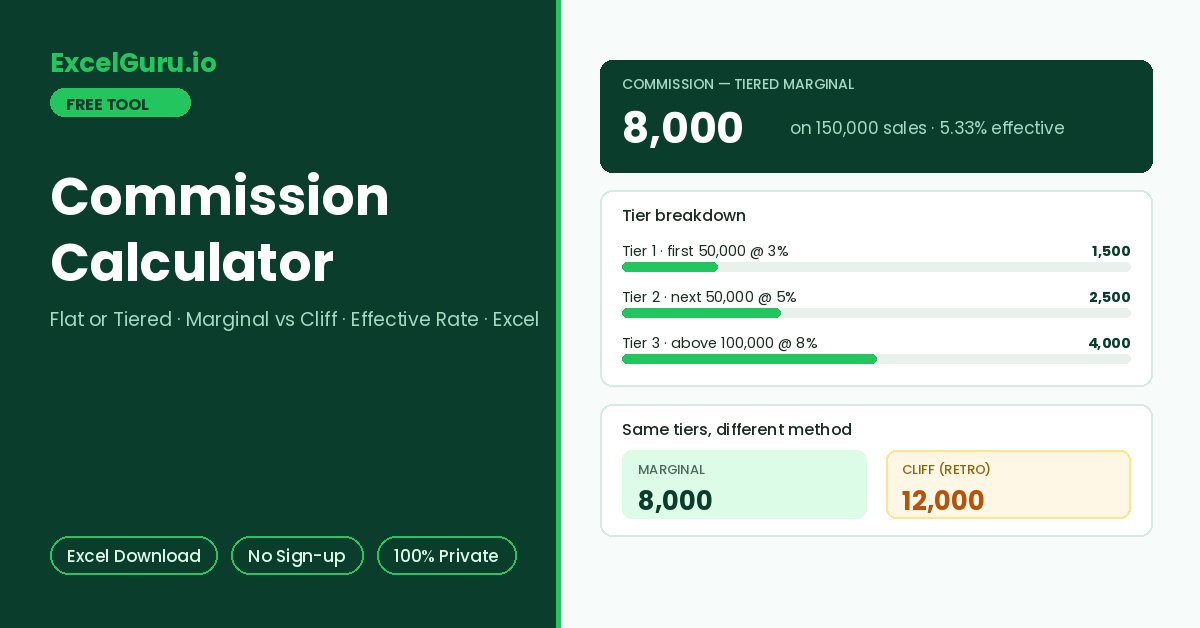
Commission, the tier-by-tier breakdown, effective rate, and total earnings appear here.
How to Use the Commission Calculator
Calculate sales commission under a flat rate or a three-tier structure, in marginal or cliff mode. The result shows the tier-by-tier breakdown, the effective rate, and optional total earnings with base salary. Everything exports to Excel.
Pick the plan type
Flat Rate applies one percentage to all sales. Tiered uses three editable bands — edit the two thresholds and three rates to mirror your comp plan exactly.
Choose marginal or cliff
Marginal pays each slice of sales at its own tier rate, like income tax brackets. Cliff pays the entire amount at the rate of the highest tier reached. The same sales figure can differ by thousands between the two, so match the plan wording.
Read the breakdown and export
Results show commission per tier, total commission, the effective rate, and total earnings when base salary is entered. Download the Excel file to verify a payout or model a target.
Take 150,000 of sales with tiers of 3%, 5%, and 8%. Marginal pays 1,500 + 2,500 + 4,000 = 8,000, while cliff pays the whole 150,000 at 8% = 12,000. Same numbers, 50% more money. Plans say “on incremental revenue” for marginal and “retroactive to dollar one” for cliff — find the phrase before forecasting your payout.
Commission Structures, Formulas, and Worked Examples
The flat and tiered commission formulas, marginal versus cliff mechanics, typical structure choices, a worked example, and the Excel formulas that reproduce each.
Flat rate — the baseline structure
Flat commission multiplies sales by one rate: simple to compute, simple to audit, and predictable for finance. Its weakness is motivational — the 10th sale pays the same as the 1st, so there is no acceleration for beating target. That is exactly the gap tiered plans exist to fill.
Marginal versus cliff — the same tiers, different money
Marginal tiers pay each band of revenue at that band’s rate, so crossing a threshold only improves the rate on the revenue above it. Cliff tiers re-rate everything once a threshold is crossed, which creates powerful jumps — and equally powerful edge cases. Under a cliff plan, one extra sale near a boundary can add thousands. Consequently, deals mysteriously cluster just past thresholds at period end. Finance teams call this threshold gaming, and it is the main reason many plans prefer marginal structures.
Worked example — 150,000 sales, three tiers
Tiers: up to 50,000 at 3%, then to 100,000 at 5%, above that 8%. Marginal: the first 50,000 earns 1,500, the next earns 2,500, and the final slice earns 4,000. That totals 8,000, a 5.33% effective rate. Cliff on identical numbers: 150,000 × 8% = 12,000, an 8% effective rate. With a 40,000 base for the period, total earnings become 48,000 or 52,000 respectively.
Flat is =Sales*Rate. Marginal three-tier with sales in B2 and caps in D1, D2: =MIN(B2,D1)*3% + MAX(0,MIN(B2,D2)-D1)*5% + MAX(0,B2-D2)*8% — each MIN/MAX pair isolates one slice. Cliff uses =B2*IFS(B2>D2,8%,B2>D1,5%,TRUE,3%). The exported file shows every slice on its own row so a payout can be audited in seconds.
Reading a real comp plan against this calculator
Real plans add mechanics around the core math. These include quota retirement rules, split credits between reps, clawbacks when deals churn, payout caps, and accelerators above 100% of quota. None of these change the tier arithmetic — they change which sales number goes in. Consequently, the reliable workflow is to compute the creditable sales figure per the plan first, then run it through the structure here to verify the payout line.
Commission disputes are contract questions: crediting rules, timing, clawbacks, and caps live in the signed plan, not in the arithmetic. Use this calculator to verify math and model scenarios. For binding figures, rely on the compensation plan document or the person who administers it.
Frequently Asked Questions
Common questions about commission structures, tiers, effective rates, and the Excel export.