
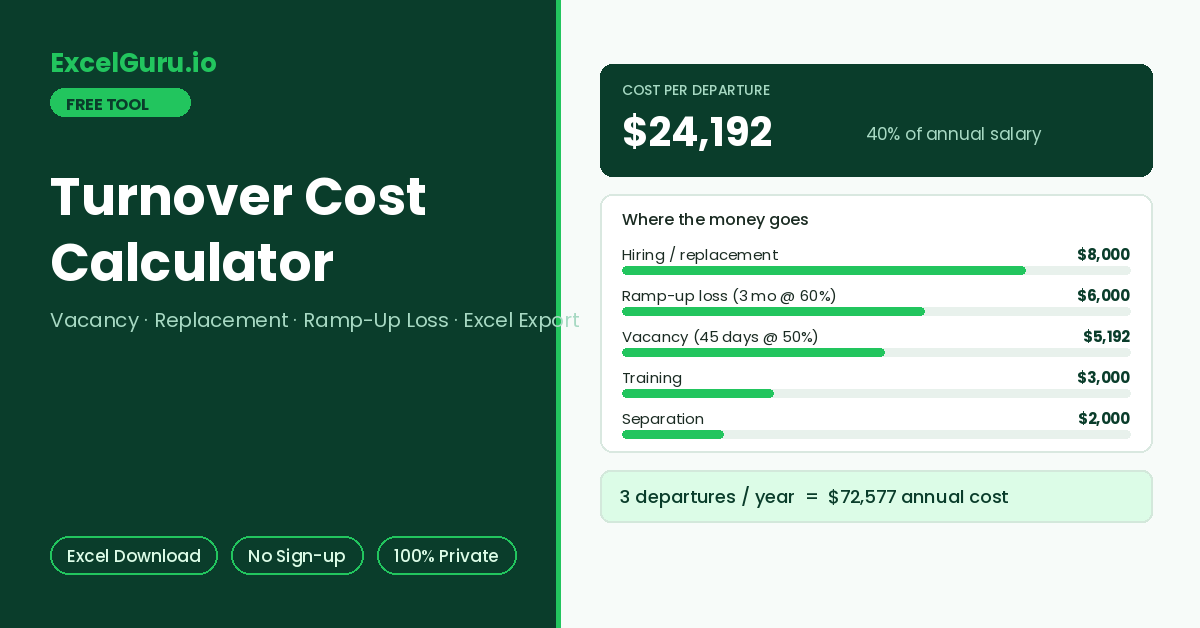
Cost per departure, annual cost, percentage of salary, and the component breakdown appear here.
How to Use the Turnover Cost Calculator
Put a defensible money figure on employee turnover. The detailed mode builds cost per departure from separation, vacancy, replacement, and ramp-up components; the quick mode applies research-based salary multipliers. Both export an itemized Excel file.
Choose the mode
Detailed Build-Up itemizes each cost component and suits business cases that will face scrutiny. Quick Multiplier applies a salary multiple — useful for a first estimate or when component data is not yet available.
Enter role and cost inputs
Type the annual salary and departures per year. In detailed mode, add separation costs, vacancy days with an impact percentage, hiring and training costs, and the replacement ramp-up profile.
Read the total and export
Results show cost per departure, the annual total, cost as a percentage of salary, and the components ranked by size. Download the Excel file for the retention business case.
This calculator prices each departure; a turnover rate tells you how many departures to expect. Multiply the two — cost per departure × expected annual leavers — and the retention conversation changes from percentages to money. A 20% rate on a 50-person team at 30,000 per departure is 300,000 a year, a figure any budget owner understands immediately.
What Employee Turnover Really Costs — Components and Formulas
The four cost components of a departure, the formula behind each, multiplier benchmarks, a worked example, and Excel formulas for your own model.
The four components of turnover cost
Every departure triggers four cost streams. First, separation costs are the visible exit expenses: admin time, leave payouts, and any severance. Second, vacancy cost is the productivity lost while the seat is empty. Third, replacement cost is what hiring the successor consumes. Finally, ramp-up cost captures the gap between a new hire’s full salary and their partial output during the learning curve. It is usually the largest and most ignored component.
Commonly cited multiplier benchmarks
These multiples appear across HR research from sources such as SHRM, Gallup, and the Work Institute, and they are directional rather than precise. This is exactly why the detailed build-up exists. Your own component numbers — actual vacancy days, actual agency fees — always beat a borrowed multiplier in credibility.
Worked example — 60,000 salary, 45 vacant days
For example, take a 60,000 role with one departure. Separation admin costs 2,000. The seat stays vacant 45 working days at 50% productivity impact: 60,000 ÷ 260 × 45 × 0.5 = 5,192. In addition, hiring the replacement costs 8,000 and training costs 3,000. The new hire needs 3 months to reach full productivity, averaging 60% along the way. That ramp costs 5,000 × 3 × 0.4 = 6,000 in paid-but-unproductive time. Total: 24,192 per departure — about 40% of salary, and ramp-up plus vacancy make up nearly half of it.
Vacancy cost is =Salary/260*VacantDays*Impact. Ramp-up loss is =Salary/12*RampMonths*(1-AvgProductivity). Cost per departure is a plain =SUM() across the five components, and the annual figure is =CostPerDeparture*Leavers. To express it as a salary multiple, divide by salary — the exported file computes all of these with your actual inputs.
Using the number in a retention business case
Turnover cost earns its keep when compared against the cost of preventing departures. A 3,000 retention bonus looks expensive in isolation and cheap against a 24,000 departure. Similarly, the same logic prices manager training, market salary corrections, and flexible work policies. Present the comparison per departure avoided, since decision-makers respond to the marginal case. Additionally, segment by role: one regretted senior exit often outweighs several junior ones, so a blended average understates where the real money leaks.
Vacancy impact and ramp-up productivity are judgment inputs, and reasonable people will pick different values. Therefore, choose conservative figures and note the assumptions in the exported file — the resulting number will hold up in budget discussions. This calculator supports planning and business cases; it does not produce audited financial data.
Frequently Asked Questions
Common questions about turnover cost components, multipliers, assumptions, and the Excel export.