
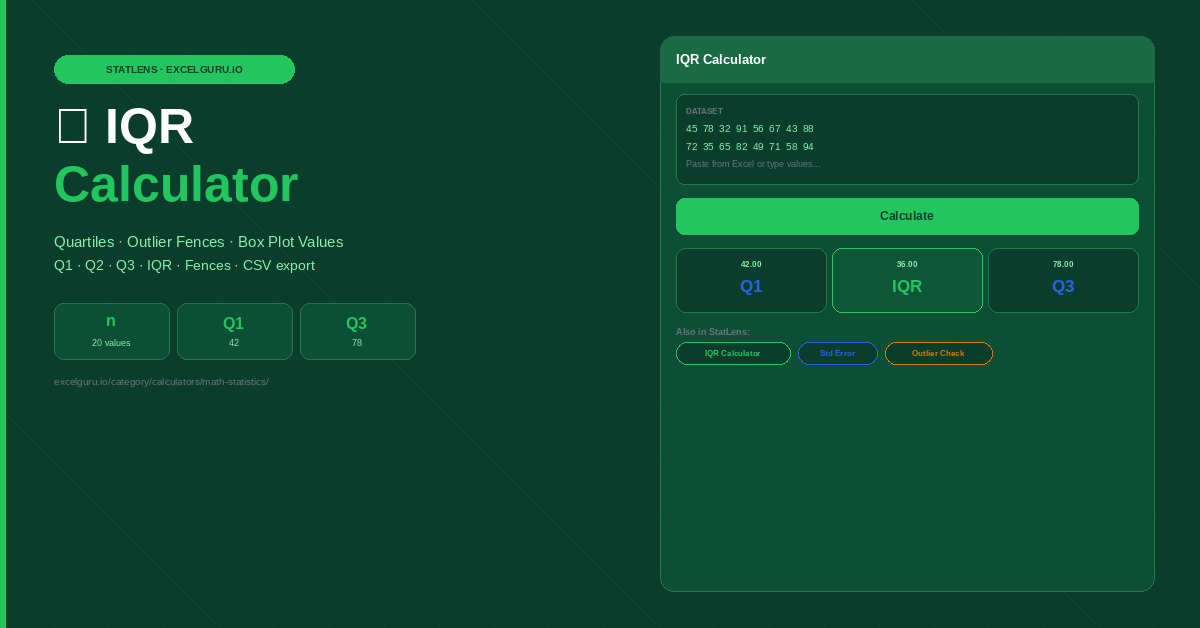
Enter your dataset and click Calculate to see results.
How to Use the IQR Calculator
Calculate the interquartile range, all four quartiles, outlier fences, and detected outliers from any numeric dataset. Paste directly from an Excel column — no reformatting required. Results include all values needed to construct or verify a box plot.
Paste your dataset
Enter numeric values by pasting an Excel column into the dataset field, or type values separated by commas or newlines. Any sample size from 4 values upward works correctly. Decimals and negative numbers are both supported. The calculator sorts values internally before computing quartiles.
Calculate quartiles and fences
Click Calculate to see Q1 (25th percentile), Q2 (median / 50th percentile), Q3 (75th percentile), IQR, lower fence, and upper fence. Values beyond the fences are outliers by the standard 1.5×IQR rule. Results match Excel's QUARTILE.INC function exactly, making them directly comparable to Excel output.
Use results for box plots and outlier review
All five values needed for a box plot — min, Q1, median, Q3, max — are shown alongside the IQR and fences. The tool lists each flagged outlier individually so you can investigate before deciding whether to keep, correct, or exclude it.
Outliers pull standard deviation toward them because the calculation uses the mean. IQR uses only the 25th and 75th percentiles — neither of which is affected by values in the tails. This makes IQR the better spread measure whenever you report the median instead of the mean. Median and IQR always go together; mean and standard deviation go together. Mixing them (median with SD, or mean with IQR) is statistically inconsistent.
IQR Formula, Quartile Calculation, Outlier Fences, and Box Plots
How Q1, Q2, and Q3 are computed, the IQR formula, outlier fence construction, box plot anatomy, the Excel QUARTILE.INC formula, and why IQR is more robust than range or standard deviation for skewed data.
The IQR formula
The interquartile range is the difference between the 75th and 25th percentiles. It captures the spread of the middle 50% of the dataset — the region most representative of typical values. Because the bottom 25% and top 25% of values are excluded, extreme values in either tail have no effect on IQR.
How quartiles are calculated
Q1 is the median of the lower half of the sorted dataset, Q2 is the overall median, and Q3 is the median of the upper half. Several different calculation methods exist — Excel's QUARTILE.INC uses linear interpolation between adjacent values when the target percentile falls between two positions. This calculator uses the same interpolation method, ensuring results match Excel exactly. For small datasets, different methods can produce visibly different quartile values, which is why matching the method to your software is important.
Sorted: 55, 60, 65, 70, 72, 78, 85, 90. n=8. Q1=63.75, Q3=79.75.
Data: 120, 130, 125, 118, 122, 5. The 5ms reading is suspect.
Monthly sales: 1200, 1500, 1700, 2000, 2100, 2400. No outliers.
Q1=165, Q3=180, IQR=15. Fences: 142.5 to 202.5.
Box plot anatomy — what each element represents
Box plots draw a rectangle from Q1 to Q3, with width equal to the IQR. Inside the box, a vertical line marks the median (Q2). Whiskers extend from the box edges to the most extreme non-outlier values within 1.5×IQR of Q1 and Q3. Individual points beyond the whiskers are plotted as separate dots — those are the flagged outliers. The asymmetry of the box (median closer to Q1 or Q3) reveals skewness at a glance without any formula.
Excel's Box and Whisker chart (available from Excel 2016 onward) computes and plots all quartile values automatically from raw data. To compute IQR manually, use =QUARTILE.INC(range,3)−QUARTILE.INC(range,1). The lower fence is =QUARTILE.INC(range,1)−1.5*(QUARTILE.INC(range,3)−QUARTILE.INC(range,1)). These formulas match this calculator's output exactly.
IQR vs range vs standard deviation for spread
Range (max minus min) is the simplest spread measure but is entirely determined by the two most extreme values in the dataset. Adding one outlier can double the range without changing anything else. Standard deviation uses every value in the computation and is sensitive to outliers because it uses the mean. IQR is the most robust of the three — it is immune to values in the top and bottom 25% of the distribution. For skewed data, heavily tailed distributions, or any dataset where outliers are present, IQR gives a more representative picture of typical spread than either range or SD.
Frequently Asked Questions
Common questions about interquartile range, quartile calculation methods, outlier fences, and box plot construction.