
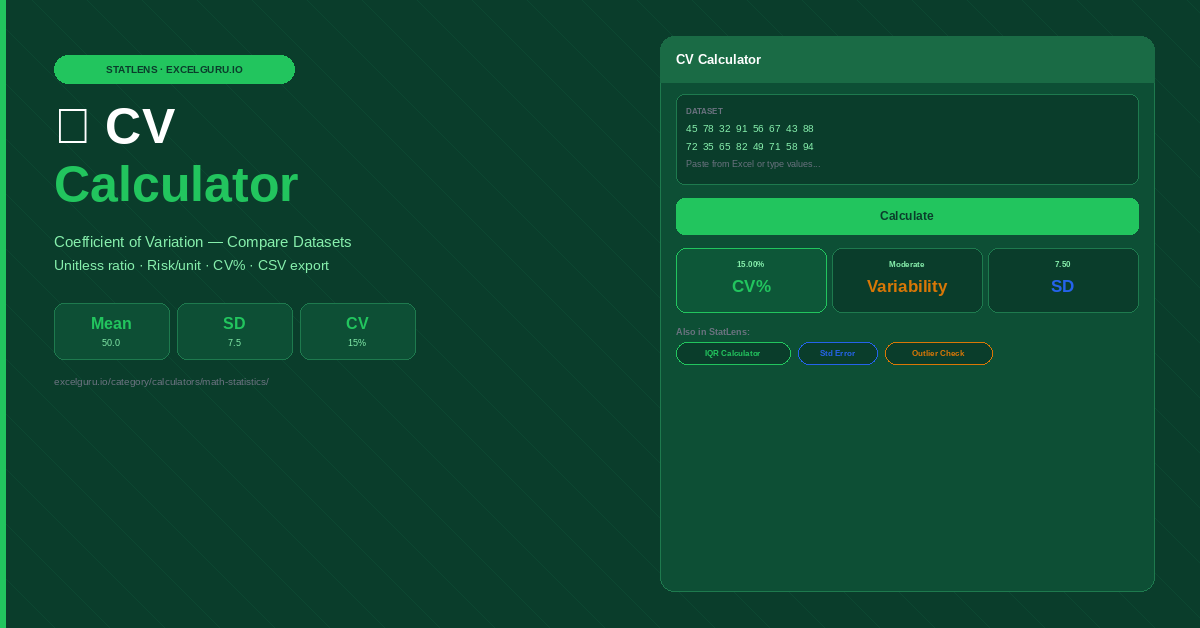
Enter your data and click Calculate.
How to Use the CV Calculator
Calculate the coefficient of variation from a raw dataset or from a known mean and standard deviation. CV% expresses variability relative to the mean, making it possible to compare the consistency of datasets measured in entirely different units or at different scales.
Choose raw data or summary stats
Paste a dataset directly from Excel in Raw Data mode — the calculator computes mean, standard deviation, and CV automatically. Already have summary figures? Summary Stats mode accepts a known mean and standard deviation directly from a report, textbook, or prior analysis.
Calculate and read the CV
Click Calculate to see CV% alongside mean, standard deviation, and a variability interpretation. The interpretation card classifies the result as very low (<5%), moderate (5–15%), high (15–30%), or very high (>30%) relative variability. These thresholds vary by field — the result card provides guidance on when each range is acceptable.
Compare across multiple datasets
Run the calculator separately for each dataset you want to compare, then compare the CV% values directly. Because CV is unitless, you can compare the variability of heights in centimetres against weights in kilograms — a comparison that raw standard deviation cannot make. The dataset with the higher CV has greater relative variability regardless of scale or unit.
CV divides SD by the mean, which only makes sense when the mean is positive and the data is measured on a ratio scale (where zero means a genuine absence of the quantity). Height, weight, revenue, and time are ratio scales — CV is valid. Celsius temperature, IQ scores, and Likert ratings are interval scales with no true zero — CV is not meaningful for these. Also, when the mean is close to zero, CV can become extremely large or undefined, even when absolute variability is small.
Coefficient of Variation Formula, Thresholds, and Applications
The CV formula, when to use CV instead of standard deviation, field-specific thresholds, financial risk applications, laboratory precision standards, and the Excel formula.
The coefficient of variation formula
CV expresses standard deviation as a percentage of the mean. This normalisation removes units and scale from the variability measure, enabling direct comparison between datasets that would otherwise be incomparable. A CV of 15% means the standard deviation is 15% of the mean — regardless of whether the data is measured in millimetres, AED, or seconds.
CV thresholds by field
Fund A: mean return 10%, SD 2%. The second fund targets 20% mean return with SD 5%.
Product A: mean 100mm, SD 0.5mm. The smaller part targets 10mm with SD 0.1mm.
Glucose assay repeated 10 times: mean 5.2 mmol/L, SD 0.15 mmol/L.
Monthly actual vs forecast: mean AED 120K, SD AED 36K.
CV in financial risk analysis
In portfolio management, CV represents risk per unit of expected return — a key concept in risk-adjusted performance. An investment with a mean annual return of 8% and standard deviation of 4% has CV = 50%. Another with mean 15% and SD 6% has CV = 40%. Despite higher absolute volatility, the second investment offers more return per unit of risk. This comparison is impossible using standard deviation alone because the return bases differ. Fund managers use CV alongside Sharpe ratio and other risk-adjusted metrics to compare investment efficiency.
Do not use CV when the mean is zero (CV becomes infinite or undefined), when the mean is negative (CV loses meaningful interpretation), or when data is measured on an interval scale without a true zero — such as Celsius temperatures, IQ scores, or standardised test scores. For these scales, absolute standard deviation is the correct variability measure. Also avoid CV when comparing datasets with very different means where the relationship between SD and mean is not proportional.
Excel formula for coefficient of variation
Calculate CV in Excel as =STDEV(range)/AVERAGE(range)*100 to get CV as a percentage. Omit the ×100 if you prefer a decimal ratio. For population CV, replace STDEV with STDEV.P. Add an IFERROR wrapper — =IFERROR(STDEV(range)/AVERAGE(range)*100,"N/A") — to handle zero-mean ranges gracefully without generating a division-by-zero error. Format the result cell as a percentage or as a number with one or two decimal places depending on the precision required in your report.
Frequently Asked Questions
Common questions about coefficient of variation, when it applies, field-specific thresholds, and financial risk applications.