
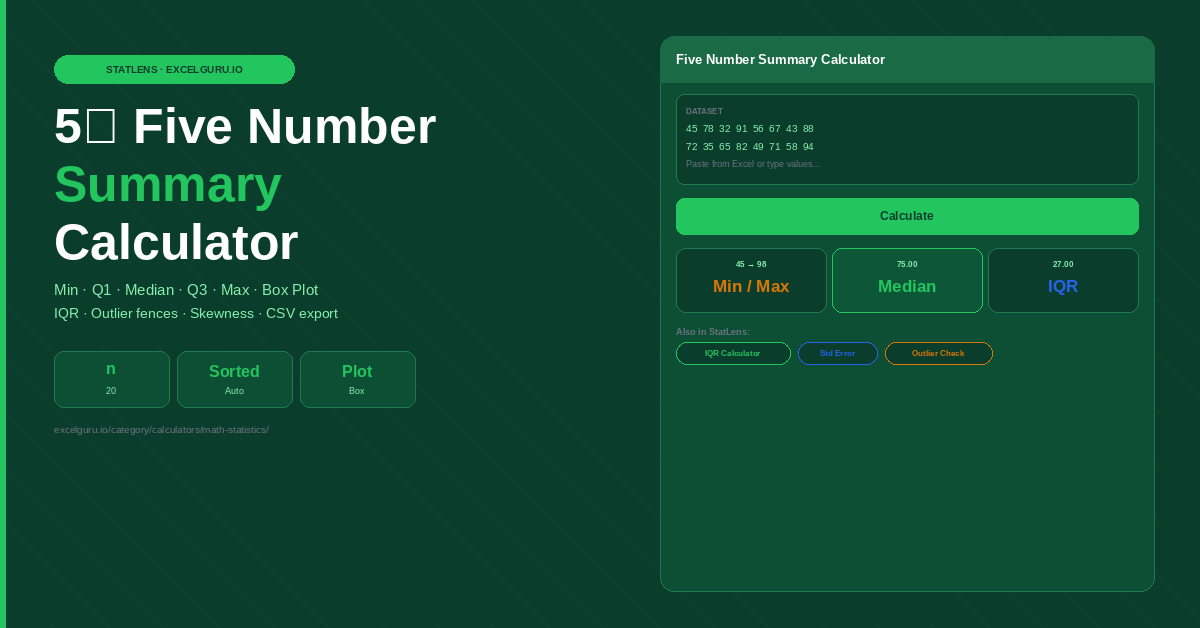
Enter your dataset and click Calculate to see results.
How to Use the Five Number Summary Calculator
Calculate the complete five number summary — minimum, Q1, median, Q3, and maximum — from any numeric dataset. Results include IQR, outlier fences, detected outliers, and a skewness interpretation. One step delivers all values needed for a box plot.
Paste your dataset
Enter values by pasting a column directly from Excel, or type values separated by commas or newlines. Any sample size from 4 values upward works correctly. Both decimals and negative numbers are fully accepted. Internally, the calculator sorts all values before computing each summary component.
Calculate all five components
Click Calculate to see minimum, Q1, Q2 (median), Q3, and maximum — the five numbers that fully describe a distribution's shape. IQR, outlier fences, and flagged outliers appear automatically. Skewness shows in the median's position within the box. It signals symmetric, right-skewed, or left-skewed distribution.
Use for box plots and distribution comparison
Results give all values needed to draw a box plot by hand, verify a software-generated chart, or describe a distribution in writing. Download the CSV to include the summary in a report, compare two datasets in a table, or share values with a colleague for charting.
If the median sits at the midpoint of the box (equidistant from Q1 and Q3), the data is roughly symmetric. Right skew appears when the median sits closer to Q1 than Q3, leaving a longer upper tail. Left skew appears when the median sits closer to Q3, with a longer lower tail. Whisker lengths confirm the finding: a longer upper whisker reinforces right skew, a longer lower whisker reinforces left skew. You can read all of this from the five numbers before drawing a single chart.
Five Number Summary, Box Plots, and Distribution Comparison
Five-component calculation method, box plot anatomy, skewness interpretation, side-by-side distribution comparison, Excel functions, and EDA applications.
The five components
John Tukey introduced the five number summary as a quick, robust way to describe distributions. No mean or standard deviation is needed. Deliberately resistant to outliers — min and max can shift with extreme values, but Q1, median, and Q3 cannot. This makes it ideal for exploratory data analysis where you want a complete distributional picture before committing to any modelling assumptions.
Worked examples with interpretation
Data: 45,55,60,65,72,78,82,88,92,98. n=10.
Data: 800,1200,1400,1500,1600,1800,2200,3500. Right-skewed — one high month.
Data: 95,100,105,108,110,112,115,118,120,200ms. The 200ms value is suspect.
Survey ages: 20,22,25,28,30,32,35,38,40,43. Evenly spread.
Box plot anatomy — reading one correctly
A standard box plot draws a rectangle from Q1 to Q3. Inside the box, a line marks the median. Whiskers extend from Q1 downward to the lowest non-outlier value within 1.5×IQR, and from Q3 upward to the highest non-outlier value within 1.5×IQR. Values beyond the whiskers are plotted as individual dots. The box represents the middle 50% of the data. Narrow boxes indicate consistent data; wide boxes indicate high spread. The median line's position within the box shows skewness direction.
Consequently, box plots are most powerful when comparing two or more groups on the same scale. Place the box plots side by side with a shared y-axis. Median heights show which group is typically higher. Box widths (IQR) show which group has more middle spread. Finally, whisker lengths reveal which group has longer tails. Additionally, check for outlier dots to spot individual unusual cases. Notably, all of this information comes from the five number summary — no mean or SD required.
Five number summary in Excel
In Excel, each component is calculated separately. For a dataset in A2:A50: minimum is =MIN(A2:A50), Q1 is =QUARTILE.INC(A2:A50,1), median is =MEDIAN(A2:A50), Q3 is =QUARTILE.INC(A2:A50,3), and maximum is =MAX(A2:A50). IQR is =QUARTILE.INC(A2:A50,3)−QUARTILE.INC(A2:A50,1). Excel's built-in Box and Whisker chart draws the full box plot from raw data automatically — find it under Insert → Charts → Statistical.
Applications in exploratory data analysis
The five number summary is the first step in any serious exploratory data analysis (EDA). EDA practitioners check the five number summary first. They use it to understand data shape, spot outliers, and choose parametric vs non-parametric methods — before any modelling begins. A distribution with extreme outliers or heavy skewness often warrants a log transformation or a non-parametric test rather than a standard t-test or ANOVA. The five number summary tells you this before you waste time on the wrong method.
Frequently Asked Questions
Common questions about the five number summary, quartile calculation, box plot construction, and how to read skewness from the result.