
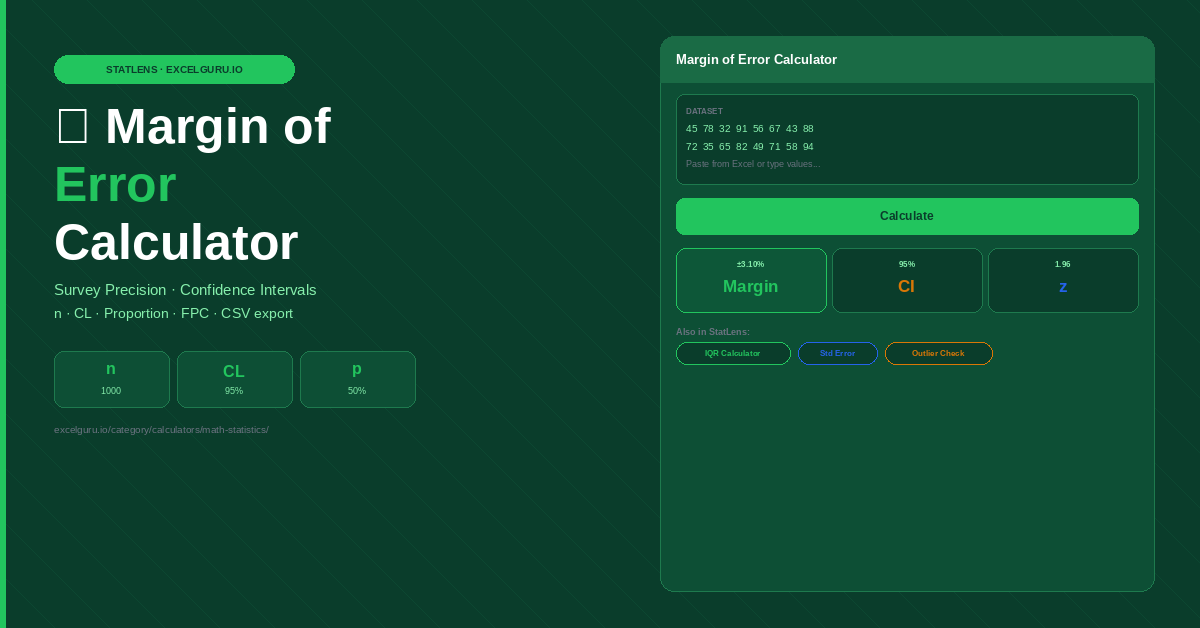
Enter your data and click Calculate.
How to Use the Margin of Error Calculator
Calculate the margin of error for a survey or poll from sample size, confidence level, and estimated proportion. Determine how precisely your survey results represent the full population, or plan the sample size needed to achieve a target margin.
Enter sample size and confidence level
Enter the number of responses collected in the Sample Size (n) field. Select your target confidence level — 90%, 95%, or 99%. Each level has a corresponding z-score: 1.645 for 90%, 1.96 for 95%, and 2.576 for 99%. Higher confidence produces a wider margin of error for the same sample size.
Set proportion and optional population size
Enter the estimated proportion of respondents expected to answer a certain way (p). Use 0.5 if unknown — this gives the largest, most conservative margin of error and ensures your survey is adequately powered regardless of the actual result. Add a population size only if your sample represents more than 5% of the total population, which triggers the finite population correction.
Read and plan from the result
The result shows the margin of error as a ± percentage. Your survey finding ± this margin is the full confidence interval. For example, 54% support with ±3% means the true value lies between 51% and 57% with your chosen confidence level. Download the CSV to document the methodology for a research report.
A survey finding of 52% support with a ±5% margin means the true population value could be anywhere from 47% to 57%. That range includes both majority and minority support — the survey cannot actually tell you which applies. For decisions with real stakes, aim for ±2% or ±3%. However, tighter margins require substantially larger samples: ±2% at 95% confidence needs about 2,401 responses; ±3% needs 1,068; ±5% needs only 385.
Margin of Error Formula, Confidence Levels, and Sample Size Planning
The MOE formula, the z-score table for common confidence levels, how to plan sample size from a target margin, the finite population correction, and common mistakes in survey reporting.
The margin of error formula
Margin of error quantifies the maximum expected difference between a survey result and the true population value. It is expressed as a ± percentage and depends on sample size, confidence level, and the proportion being estimated. Larger samples, lower confidence, and proportions far from 0.5 all reduce the margin.
Worked examples
n=1000, p=0.5, 95% CI. Classic poll configuration.
n=400, p=0.7 (70% satisfaction expected), 95% CI.
n=2000, p=0.5, 99% CI for a clinical decision.
n=100 from population N=200 — FPC applies.
Planning sample size from a target margin
Rearranging the MOE formula gives the required sample size: n = (z² × p × (1−p)) ÷ MOE². At ±5% and 95% confidence with p=0.5: n = (1.96² × 0.25) ÷ 0.05² = 384.16, rounded up to 385. A ±3% margin needs n ≈ 1,068 responses. Furthermore, ±2% needs n ≈ 2,401 responses. Notice that halving the margin roughly quadruples the required sample size — this is the square-root relationship at work. Always round sample size up, never down.
The standard MOE formula assumes an infinite (or very large) population. When your sample represents more than 5% of the total population — for example, surveying 200 employees from a company of 500 — the standard formula overstates the margin. The finite population correction is: Adjusted MOE = MOE × √((N−n)/(N−1)). For large populations (N > 10,000), the correction is negligible and can be ignored. This calculator applies it automatically when you enter a population size.
Common mistakes in survey margin of error reporting
The most frequent error is applying the overall survey margin to subgroup findings. If a poll of 1,000 people has ±3% overall, the margin for a subgroup of 200 respondents is ±6.9% — more than double. Subgroup findings always have larger margins. A second common mistake is omitting the confidence level when reporting a margin — ±3% at 90% confidence is a meaningfully different claim from ±3% at 99% confidence. Always state both the margin and the confidence level together.
Frequently Asked Questions
Common questions about margin of error, confidence levels, sample size planning, and the finite population correction.