
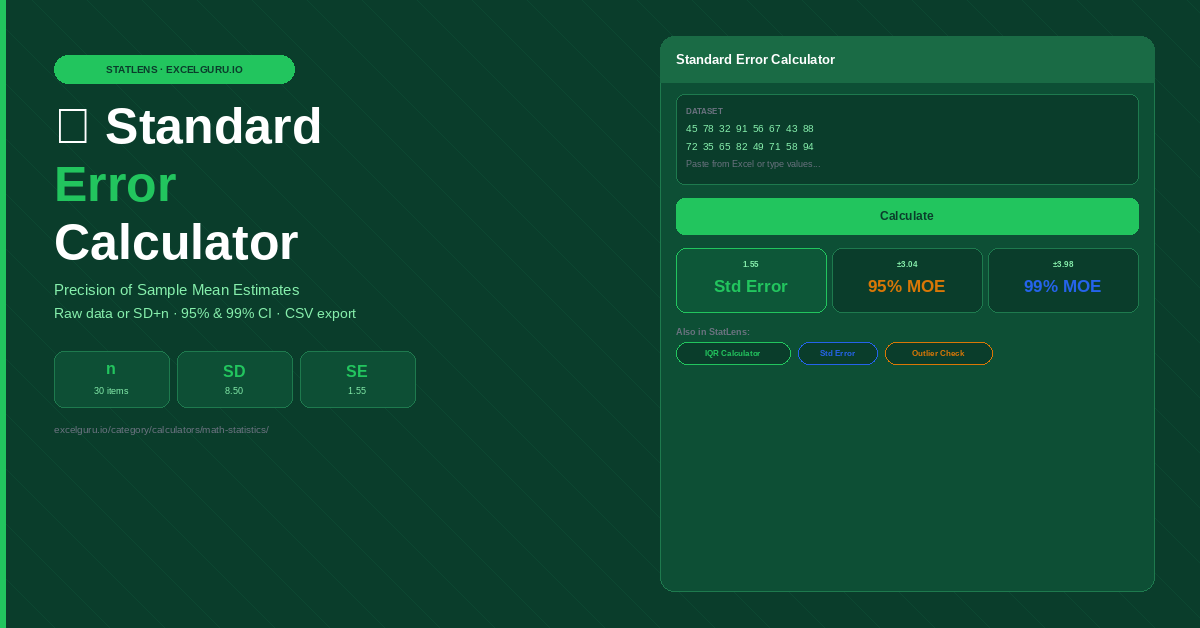
Enter your dataset and click Calculate to see results.
How to Use the Standard Error Calculator
Calculate the standard error of the mean from a raw dataset or from summary statistics. Paste values directly from Excel or enter a known standard deviation and sample size. Results include the 95% and 99% confidence interval margins automatically.
Choose input method
Paste a raw dataset into the top field to have the calculator compute mean, standard deviation, and standard error from scratch. Alternatively, leave the dataset field empty and enter your sample standard deviation and sample size directly in the summary stats fields below. Use the summary stats mode when you already have these figures from a report or reference.
Calculate and review precision
Click Calculate to see the standard error alongside the 95% and 99% confidence interval margins of error. These margins show the practical range the true population mean falls within at each confidence level. The smaller the standard error, the more precisely your sample mean estimates the true mean.
Use SE in reports and analysis
Standard error appears in academic papers, clinical trials, survey reports, and A/B test results as the precision measure for a mean estimate. Download the CSV to document the calculation for a research report or share with colleagues for peer review.
Because SE = SD ÷ √n, halving the standard error requires four times the original sample size — not double. This is why precision gains become expensive as sample size grows: going from n=100 to n=400 halves the SE, but going from n=1,000 to n=4,000 only halves it again. Understanding this relationship helps you plan data collection budgets and decide when additional sampling stops being cost-effective.
Standard Error Formula, Confidence Intervals, and Excel Usage
The standard error formula, the difference between SE and SD, how SE connects to confidence intervals, industry applications, and the Excel formula for calculating SE from raw data.
The standard error formula
Standard error of the mean (SEM) quantifies how much the sample mean is expected to vary from the true population mean if the same experiment were repeated many times. It divides the sample standard deviation by the square root of the sample size. Larger samples produce smaller standard errors — the estimate becomes more precise as more data is collected.
Standard error vs standard deviation
Within a dataset, standard deviation describes the spread of individual values — how far each data point typically lies from the mean. Precision of the sample mean as a population estimate is what standard error describes — how far the average is likely to be from the true value. Both use the same units as the data, and SE will always be smaller than SD (for n > 1) because averaging reduces variability. SD is the right choice for describing data variability. SE is the right choice when describing reliability of a mean estimate.
30 patients with mean systolic BP 128 mmHg and SD 12 mmHg. What is the SE?
100 parts measured, SD = 0.05mm. SE = 0.05 ÷ √100 = 0.005mm. Very precise estimate of true mean dimension.
400 survey respondents, SD = 1.8 points on a 10-point scale.
Control group n=500, conversion SD = 0.35. SE = 0.35 ÷ √500 = 0.0157.
Multiply SE by the critical z-value for your confidence level to get the margin of error. For the 95% level, the multiplier is 1.96. The 99% level uses 2.576 instead. Resulting confidence interval: sample mean ± margin of error. A 95% CI means that if you repeated the study 100 times, approximately 95 of the resulting intervals would contain the true population mean. Narrower SE produces narrower intervals and more precise estimates.
Excel formula for standard error
Excel has no single STERROR function, but you can compute SE as =STDEV(A1:A100)/SQRT(COUNT(A1:A100)). STDEV returns the sample standard deviation. COUNT returns the number of non-blank numeric cells. Together they give the standard error in one step. For population standard deviation (when you have the full dataset, not a sample), replace STDEV with STDEV.P. In a dashboard, show SE alongside the mean in adjacent cells so readers immediately see both the estimate and its precision.
When standard error is used in practice
Standard error appears whenever researchers or analysts need to communicate the precision of a mean estimate. Academic papers report mean ± SE in results tables. Clinical trial reports show SE to communicate the reliability of treatment effect estimates. Quality control reports use SE to confirm that a process mean has been estimated precisely enough to draw valid conclusions. A/B testing platforms display SE implicitly through their confidence interval calculations. Anywhere you see a confidence interval around a mean, SE is the foundation of that interval.
Frequently Asked Questions
Common questions about standard error, the difference from standard deviation, and how SE relates to confidence intervals and sample size.