
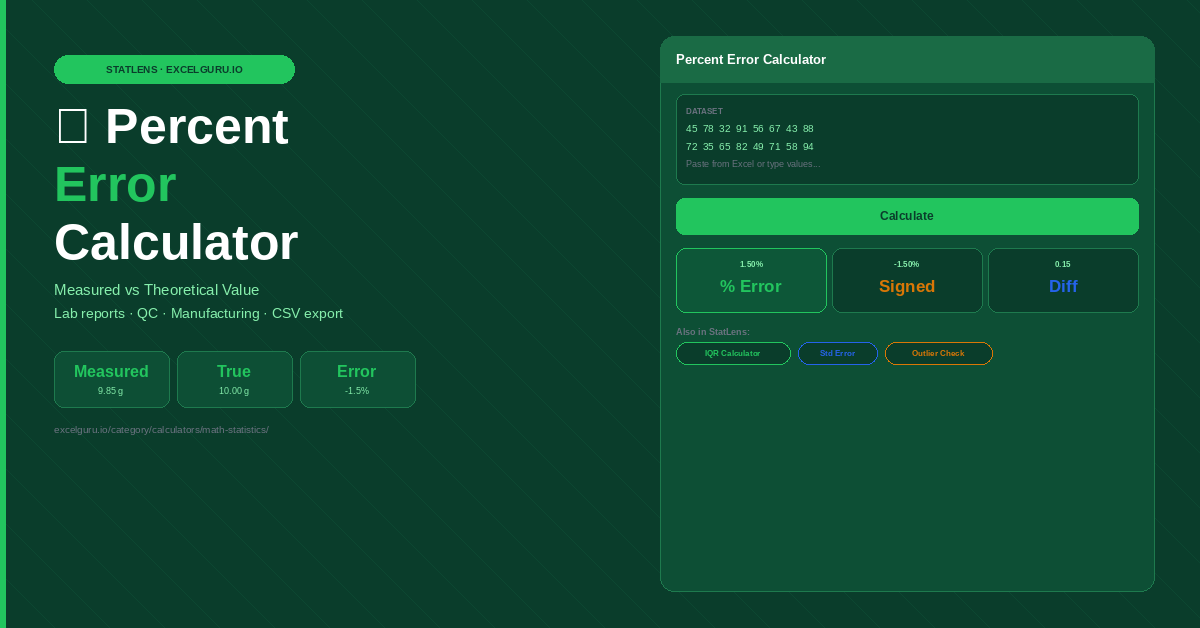
Enter your dataset and click Calculate to see results.
How to Use the Percent Error Calculator
Calculate percent error for a single measurement pair or across an entire dataset. Paste two columns directly from Excel and get per-row errors plus MAPE and RMSE in one click.
Paste your measured values
Copy your measured or experimental column from Excel and paste it into the Measured Values box. Each value goes on its own line, but commas and tabs also work. Enter as few as one value or as many as an entire production run, lab session, or forecast series.
Paste theoretical values and calculate
Copy your reference, accepted, or theoretical column into the Theoretical Values box. Both columns must contain the same number of values — the first measured value pairs with the first theoretical value, and so on. Click Calculate to see the full breakdown instantly.
Read results and export
Results show MAPE (mean absolute percent error), mean signed error for bias diagnosis, min and max error, RMSE, and a per-row table with colour-coded accuracy. Download the CSV to include the full analysis in a lab report, quality audit, or forecasting review.
Enter one value in each box to calculate error for a single observation. Fifty values work just as well — paste an entire experiment or production batch at once. The calculator handles both modes automatically. MAPE only appears when you enter multiple pairs, because a single-pair absolute percent error is already the full picture.
Percent Error Formula, Examples, and Real-World Applications
The percent error formula, how to interpret signed versus absolute results, industry accuracy benchmarks, common mistakes, and how to calculate MAPE across a dataset in Excel.
What is percent error?
Percent error measures how far a measured or experimental value is from an accepted reference value, expressed as a percentage. It answers the question: how accurate is this measurement, relative to what the true value actually is? Unlike absolute error — which is expressed in the same units as the measurement (grams, metres, seconds) — percent error is unit-free. This makes it possible to compare the accuracy of measurements across entirely different experiments, instruments, or scales.
For example, an absolute error of 0.5 kg sounds identical whether you are weighing a bag of rice or calibrating a truck scale. As a percent error, these situations differ greatly. A 25% error on a 2 kg bag is a serious problem. Meanwhile, 0.5% error on a 100 kg reference weight is well within tolerance.
Signed vs absolute percent error — which one to use
The formula above preserves the sign of the result. A positive percent error means the measured value is higher than the theoretical value. Conversely, a negative result means the measurement was lower. Both conventions appear in textbooks, but most sciences preserve the sign because direction matters — a scale that always reads high needs a different calibration fix than one that always reads low.
Absolute percent error drops the sign and reports only the magnitude of the error. Use absolute percent error when you want a single accuracy number without directional information — such as when computing MAPE, where positive and negative errors would otherwise cancel out.
This is the most common mistake. Dividing by the measured value gives a different metric called relative error from observation, which changes as the measured value changes. Percent error always divides by the reference (theoretical) value because that is the fixed standard being compared against. Additionally, if the theoretical value is zero, percent error is mathematically undefined — use percent difference instead when no true reference exists.
Worked examples across industries
A student measures gravitational acceleration as 9.62 m/s². The accepted value is 9.81 m/s².
Measurement is 1.94% below accepted — good for a school lab
A CNC mill cuts a shaft to 24.97 mm. Engineering drawing specifies 25.00 mm with ±0.2% tolerance.
Within ±0.2% tolerance — part passes inspection
Finance team forecast AED 1,200,000. Actual revenue came in at AED 1,285,000.
Forecast underestimated by 6.6% — systematic underestimation pattern
A synthesis reaction has a theoretical yield of 3.6 g. The student obtains 3.2 g after purification.
Loss to side reactions or incomplete transfer — technique review needed
Acceptable percent error thresholds by field
What counts as an acceptable percent error varies significantly across industries and settings. There is no universal standard — the threshold depends on the consequences of error in that specific context. Below are the benchmarks that practitioners and educators widely apply.
How to calculate percent error and MAPE in Excel
For a single pair, Excel's percent error formula is straightforward. If your measured value is in cell B2 and your theoretical value is in C2, use =(B2−C2)/ABS(C2)*100. This returns the signed percent error. To get the absolute percent error for a single pair, wrap it in ABS: =ABS((B2−C2)/ABS(C2))*100.
For a full dataset, Mean Absolute Percent Error (MAPE) across a range is calculated as =AVERAGE(ABS((B2:B20−C2:C20)/ABS(C2:C20))*100). Enter this as an array formula with Ctrl+Shift+Enter in older Excel versions. In Excel 365 and Excel 2021, it resolves automatically without the array shortcut. MAPE gives you the single headline accuracy number for a model, forecast, or instrument across all observations.
Compute the mean signed error alongside MAPE. If the mean signed error is consistently positive, your measurements or forecasts are systematically too high — the process has a bias. A consistent negative mean signed error means systematic underestimation. When the mean signed error is near zero but MAPE is high, errors cancel each other out — the process has random variation rather than systematic bias. Each pattern calls for a different corrective action.
Percent error vs percent change vs percent difference
These three calculations look similar but answer different questions and use different denominators. Confusing them produces incorrect results.
Apply percent error when a definitive reference or theoretical value exists — a lab constant, a design specification, or an accepted standard. Use percent change when comparing the same quantity at two different points in time. Percent difference applies when comparing two equally-uncertain measurements with no fixed reference — for example, two vendors' quotes or two survey responses.
MAPE vs RMSE — when to use each
MAPE and RMSE are both summary accuracy metrics for datasets, but they treat errors differently. Being scale-independent, MAPE expresses errors as percentages — you can compare the accuracy of models forecasting revenue in millions against models forecasting unit counts in the thousands. However, MAPE is undefined when any theoretical value is zero and is unreliable with low-volume data.
RMSE (Root Mean Square Error) is expressed in the same units as the data and penalises large individual errors more heavily than small ones, because it squares each error before averaging. Use RMSE when large errors are especially costly and you want those outlier errors to have more weight in the accuracy metric. MAPE is the better choice when you need a percentage-based, scale-independent figure that is easy to communicate to non-technical stakeholders.
Frequently Asked Questions About Percent Error
Common questions about the percent error formula, how to interpret results, when to use signed versus absolute error, and how to apply it in Excel and real-world datasets.