Popular Template Categories
Quick access to useful Excel template sections.
Explore Online Tools
Use smart tools to simplify your work instantly.
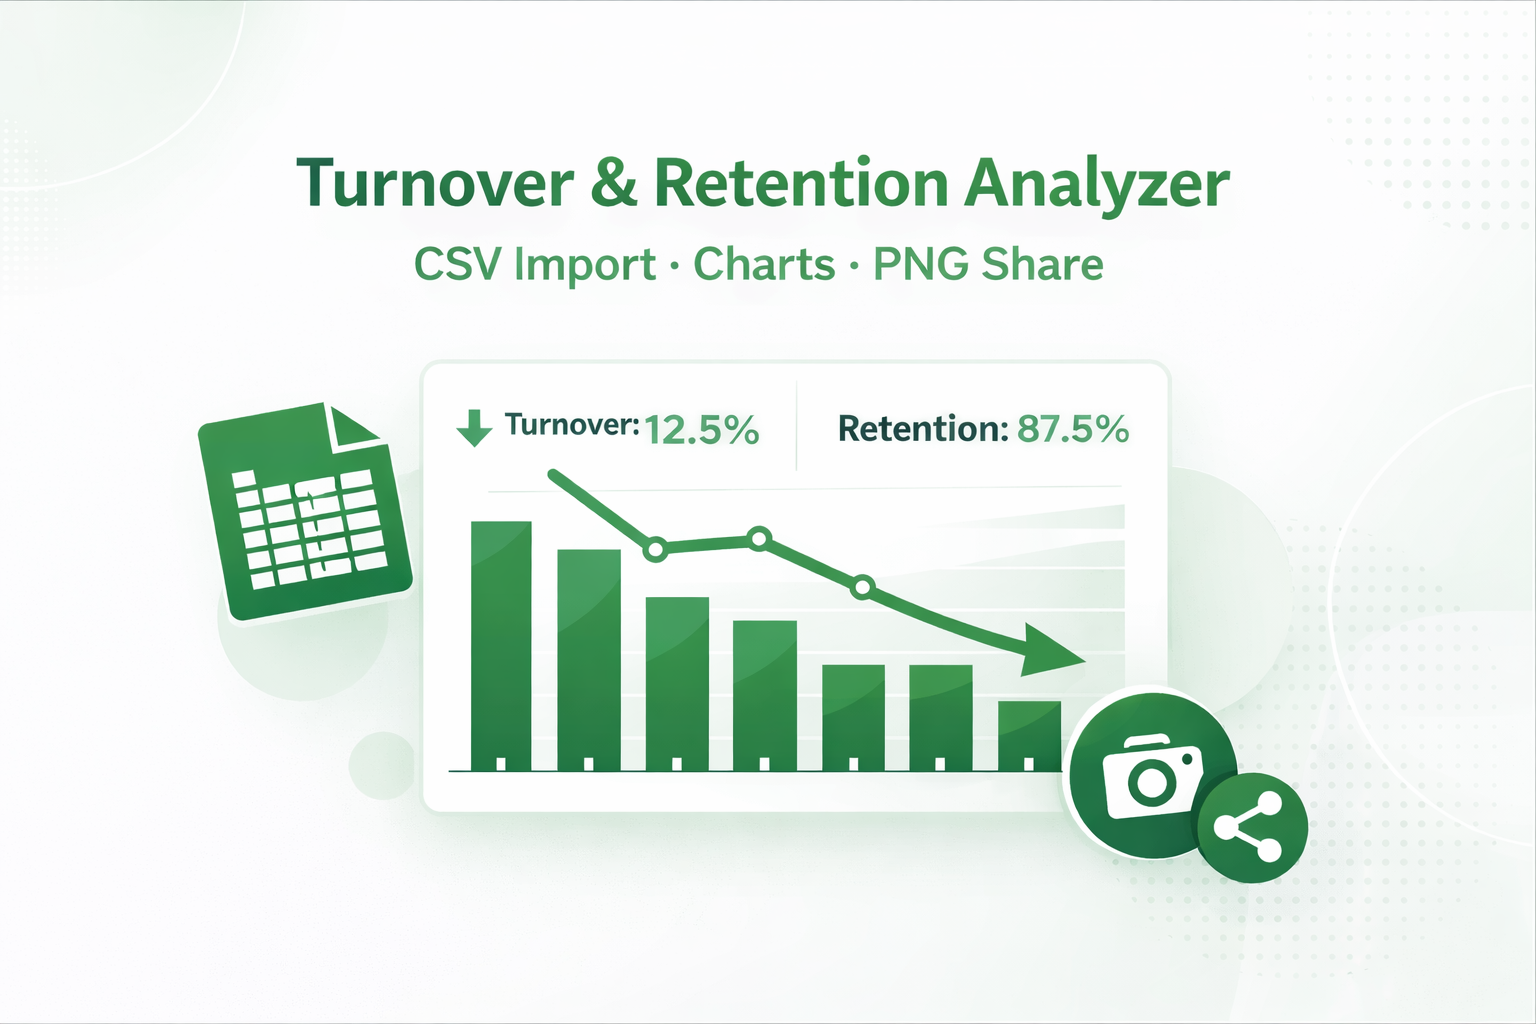
Turnover and Retention Analyzer
Drag & drop or click to upload CSV
Headers: EmployeeID, HireDate, TerminationDate, TerminationType, Department
Department Turnover Rate (%)
Turnover by Department
| Department | Avg Headcount | Terminations | Turnover Rate | Voluntary % |
|---|
Core HR Concepts: Turnover and Retention Explained
Understanding employee turnover and retention is critical for workforce planning, cost management, and company culture. Below we break down definitions, formulas, real-world examples, and use cases.
What is Employee Turnover?
Employee turnover refers to the total number of employees who leave an organization over a specific period (voluntarily or involuntarily). It is usually expressed as a percentage of the average workforce. High turnover can indicate dissatisfaction, poor management, or competitive pressures, while extremely low turnover might signal stagnation.
Turnover Formula:
Turnover Rate = (Number of Separations during period / Average Headcount during period) × 100
Where Average Headcount = (Headcount at start + Headcount at end) / 2, or more precisely, the average of monthly headcounts over 12 months (as used in our tool).
Example: If a company had 100 employees on average over the year and 15 left, the annual turnover rate = (15/100)×100 = 15%.
Use cases: Benchmarking against industry standards, identifying problem departments, calculating cost of turnover (replacement costs = 50-200% of salary).
What is Employee Retention?
Employee retention measures the organization's ability to keep its employees. Retention rate is the inverse of turnover: the percentage of employees who stay during a given period. High retention saves recruitment costs and preserves institutional knowledge.
Retention Formula:
Retention Rate = (Number of employees who stayed during period / Starting headcount) × 100
Or simpler: Retention Rate = 100% – Turnover Rate (approximate, but accurate for full period).
Example: If you started the year with 120 employees and 15 left (net after hires might be different), the retention rate (based on staying employees) = (105/120)×100 = 87.5%.
Why it matters: Retention strategies (career development, recognition, flexible work) directly reduce turnover costs. Our tool helps you pinpoint where retention is weakest.
Voluntary vs Involuntary Turnover
Voluntary turnover includes resignations, retirements, or employees leaving for personal reasons. Involuntary turnover includes layoffs, terminations, or firings. Analyzing both separately gives deeper insight: high voluntary turnover often points to culture issues, while high involuntary may indicate hiring or performance management problems.
Our calculator automatically splits these when your CSV includes TerminationType (Voluntary/Involuntary).
Departmental Turnover Analysis
Not all teams experience the same churn. Our tool calculates turnover per department using average headcount specific to each department, allowing you to prioritize retention efforts where they are needed most.
Comparison: How Our Analyzer Stands Out
| Feature | ExcelGuru.io Analyzer | Generic Online Calculators | Manual Excel |
|---|---|---|---|
| CSV Import & Automation | ✅ Instant + template | ❌ Manual entry | ❌ Complex formulas |
| Turnover by Department | ✅ Table + Chart | ❌ Usually overall only | ✅ But time-consuming |
| Voluntary/Involuntary Split | ✅ Yes | ❌ Rare | ✅ Needs extra work |
| PNG Export & Sharing | ✅ WhatsApp, Email, download | ❌ Screenshot only | ❌ No built-in sharing |
| Data Privacy | ✅ 100% client-side | ⚠️ Often server upload | ✅ Local |
| Cost | ✅ Free | ⚠️ Freemium | ✅ Part of Office |
How to Use This Tool (Step by Step)
- Download a sample CSV (click “Sample CSV”) to see realistic employee data.
- Prepare your data – fill in EmployeeID, HireDate (YYYY-MM-DD), TerminationDate (blank if active), TerminationType (Voluntary/Involuntary), Department.
- Upload your CSV by drag & drop or clicking the upload area.
- Review KPIs – overall turnover, voluntary turnover, retention rate, average headcount.
- Analyze department chart – identify high-churn teams.
- Export results – as CSV for Excel or as PNG for presentations.
- Share via WhatsApp or Email – one-click sharing of the dashboard image.
Frequently Asked Questions
EmployeeID, HireDate, TerminationDate, TerminationType, Department. Dates can be YYYY-MM-DD or MM/DD/YYYY. Use the empty template as a reference.Why HR Leaders Love This Tool
“I used to spend 3 hours every month calculating turnover rates in Excel. Now I upload a CSV and get a professional chart and KPI dashboard in seconds. Sharing via WhatsApp to the CEO is a lifesaver.” – HR Director, Tech Startup. Our tool reduces reporting time by 95% and gives you a competitive edge in retention strategy.