
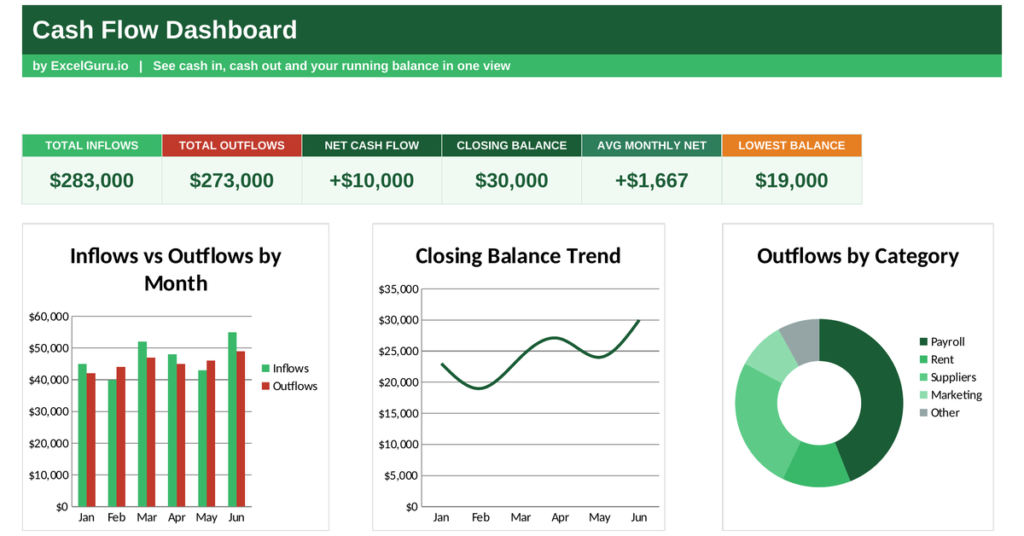
A business can be profitable on paper and still collapse if it runs out of cash. Profit is an opinion; cash is a fact, and the timing of money in and out is what keeps the lights on. A cash flow dashboard tracks that timing, showing exactly when your balance rises and when it runs thin. This free Excel template records money in and out, builds a running balance, and flags your leanest month. Below you will learn what cash flow is, the formula behind it, and how the template calculates every figure.
What is cash flow?
Cash flow is the movement of actual money into and out of your business over time. It is not the same as profit, which counts income and costs whether or not the cash has arrived.
Money comes in from sales and other sources, and goes out as wages, rent, stock and bills. What matters is the timing: a profitable business can still hit a wall if a big bill lands before a customer pays. Because you cannot spend profit that has not turned into cash, tracking flow is survival. So a cash flow dashboard watches the lifeblood of the business, not just the scoreboard.
Why cash flow matters more than profit
Plenty of profitable businesses fail, and almost always for the same reason. They run out of cash at the wrong moment.
Profit can be tied up in unpaid invoices or unsold stock, none of which pays this month’s wages. A dashboard reveals the gaps between money earned and money received, so you can plan for the lean stretches. Because a cash shortfall can be fatal even in a growing business, seeing it coming is everything. So cash flow, not profit, is the number that keeps you solvent.
The cash flow formula
The dashboard builds on one simple idea, repeated month after month. Each month’s closing balance becomes the next month’s opening balance.
Net cash flow = Inflow − Outflow
Closing balance = Opening balance + Net cash flow
Next opening balance = Previous closing balance
So each month you subtract your outflow from your inflow to find the net movement. You add that to the opening balance to get the closing balance. That closing figure then rolls forward as the next month’s opening balance. Because the balance carries across months, the dashboard shows a running total, not just isolated snapshots. So you can see exactly when your cash dips lowest.
How the cash flow dashboard calculates the balance
The template needs each month’s inflow and outflow, plus a starting balance. From there it builds the running balance for you.
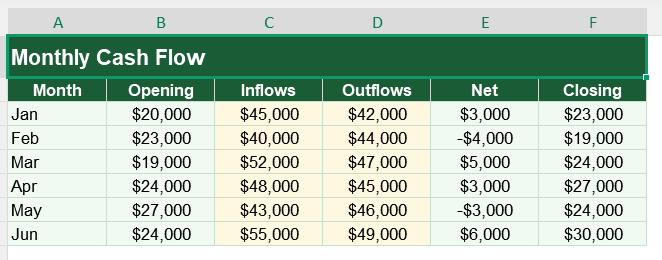
Net cash flow appears as =C3-D3, the inflow minus the outflow. The closing balance uses =B3+E3, the opening balance plus that net figure. Crucially, the next month’s opening cell reads =F3, carrying the previous closing balance forward. The dashboard then totals inflow and outflow with SUM, and finds your lowest point with MIN across the balances. So one starting figure sets off a chain that tracks your cash all year.
A worked cash flow example
Put numbers in and the chain is clear. Suppose a month opens with 20,000, takes in 45,000, and pays out 42,000.
The net cash flow is 45,000 minus 42,000, a positive 3,000. The closing balance is 20,000 plus 3,000, which is 23,000. That 23,000 then becomes next month’s opening balance, and the cycle repeats. So a run of monthly figures builds into a running balance that shows your true cash position at every point.
Reading the charts and visualization
The first chart compares inflow with outflow each month, so you can see which months you gained cash and which you burned it. The second chart plots the running balance as a line, revealing the peaks and troughs.
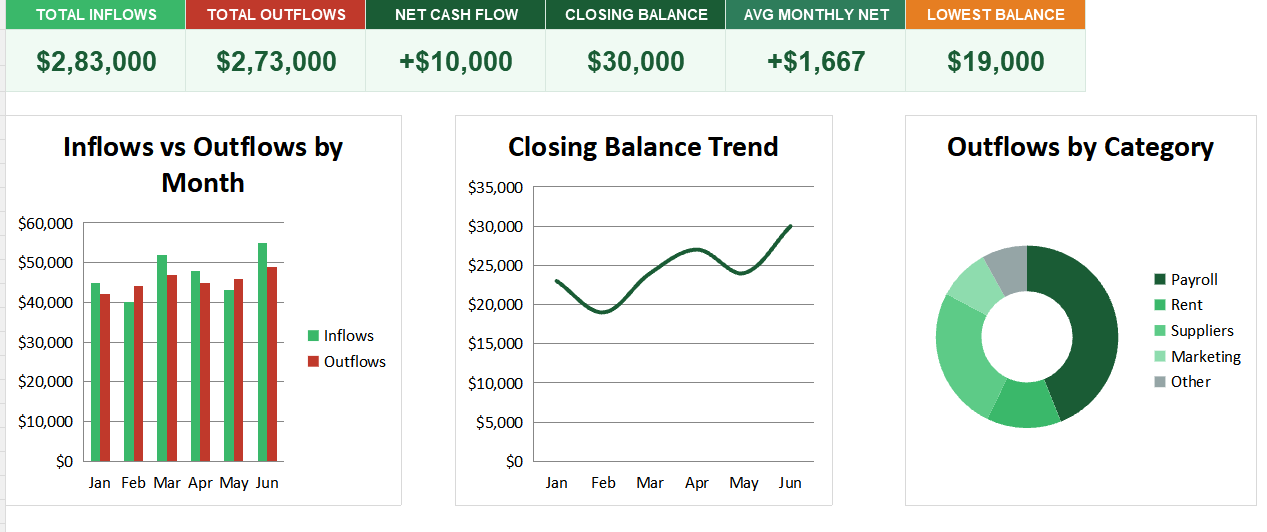
The dip in that balance line is the moment to watch, because it shows when cash runs tightest. The third chart is a doughnut splitting your outflow by type, showing where the money goes. So together the charts reveal both your cash trajectory and what drains it.
Watch your lowest balance, not your average. A healthy yearly total means nothing if a single month dips below zero and you cannot pay your bills.
Who uses a cash flow dashboard
Business owners use it to make sure they can always cover their bills. It shows them the lean months in advance.
Finance teams use it to manage liquidity and plan borrowing. Freelancers use it to smooth out irregular income. Start-ups use it to track their runway. Because every business runs on cash, the dashboard suits many settings.
Making the template your own
The template is a starting point, not a fixed form. You can extend it across a full year. You can break inflow and outflow into more detailed categories.
The dashboard bends to your needs, so you can add a forecast alongside actual figures to project ahead. A quick edit does it. You might also add a minimum-balance alert. The structure welcomes that kind of extension without complaint.
Profit keeps the score, but cash keeps you alive. A cash flow dashboard tracks money in and out and builds a running balance, so you always know when cash runs tight. So download the template, enter your figures, and make sure your business never gets caught short.
Also, The heart of cash flow is timing, not totals. Money earned and money received rarely arrive together.
You might invoice a customer today but wait sixty days for payment, while your own bills fall due next week. That gap is where businesses get caught, and it is exactly what the running balance exposes month by month.