
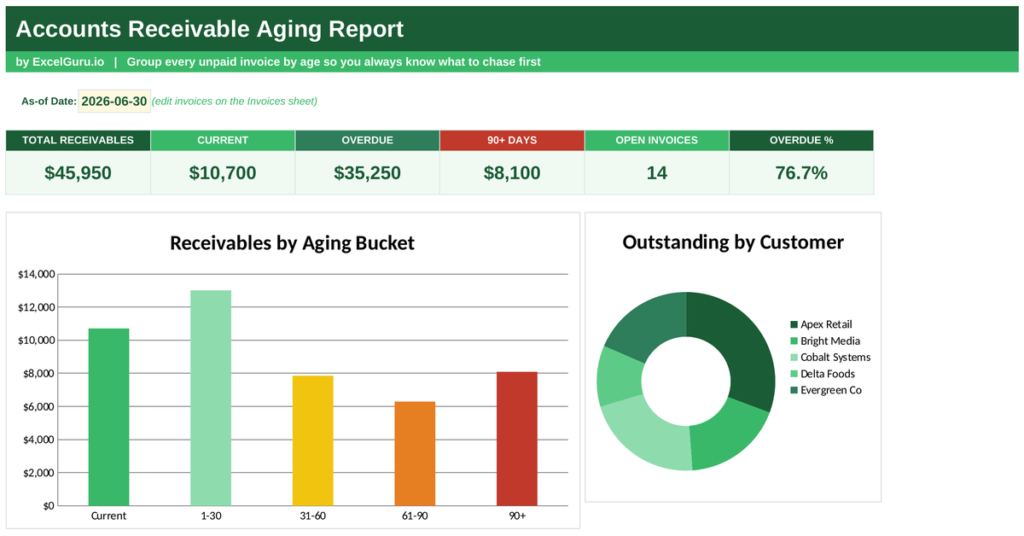
Money that customers owe you is only worth something once it lands in your account. The longer an invoice stays unpaid, the more likely it never gets paid at all. An accounts receivable aging report shows exactly how overdue every invoice is, so you can chase the right ones first. This free Excel template sorts your unpaid invoices into aging brackets, totals the overdue money, and flags the debts at real risk. Below you will learn what AR aging is, the formula behind it, and how the report builds every bucket.
What is accounts receivable aging?
Accounts receivable aging is a report that groups the money owed to you by how long it has been outstanding. It sorts every unpaid invoice into brackets based on days past due.
The brackets usually run from current, meaning not yet due, through 1-30, 31-60 and 61-90 days, up to 90 days and beyond. The pattern that matters is simple: the older a debt, the harder it is to collect. A current invoice is routine, but one sitting past 90 days is a serious warning. So the aging report turns a flat list of receivables into a clear order of collection priorities.
Why accounts receivable aging matters
Unpaid invoices quietly strangle cash flow. The cash is earned on paper, yet it cannot pay wages or suppliers until it actually arrives.
A single receivables total hides the danger completely. A business owed fifty thousand looks healthy until it learns most of it is months overdue. Old debt also carries a real risk of never being paid, which becomes a write-off. So you need receivables split by age, not rolled into one number, to see where your cash and your risk really sit.
The accounts receivable aging formula
The whole report rests on one simple calculation, repeated for every invoice. You compare the due date with the date you are reporting from.
Days overdue = As-of date − Invoice due date
Bucket: 0 or less Current, then 1-30, 31-60, 61-90, and 90+ days
So you first work out how many days each invoice is past due, by subtracting its due date from your as-of date. A negative or zero result means the invoice is not yet due, so it counts as current. A positive result drops it into the matching bracket. The further past due, the higher the bracket. So a single date subtraction drives the entire aging report.
How the template builds the aging report
The template needs only your invoices with their amounts and due dates, plus one as-of date. From there every bracket fills itself.
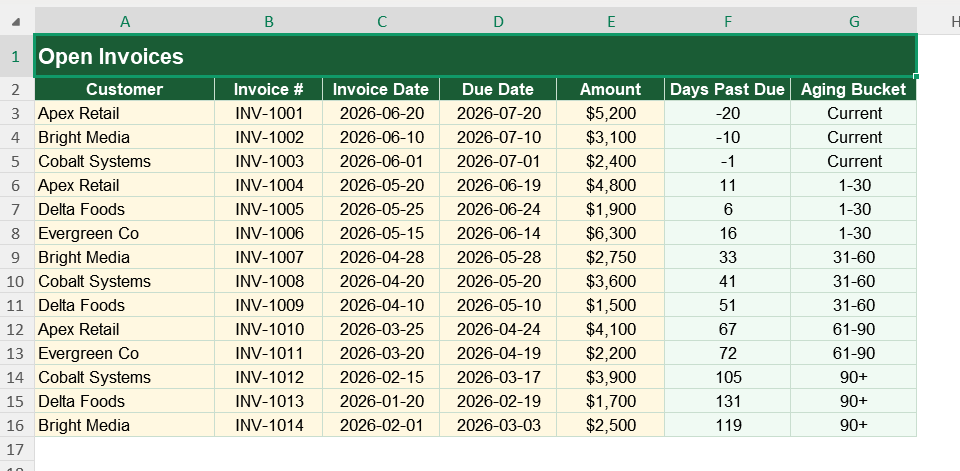
Days overdue appears as =Dashboard!$B$5-D3, the as-of date minus the invoice due date. The bracket uses a nested check, =IF(F3<=0,”Current”,IF(F3<=30,”1-30″,IF(F3<=60,”31-60″,IF(F3<=90,”61-90″,”90+”)))). The dashboard then totals each bracket with SUMIF, sums the whole ledger, and works out overdue money as the total minus the current amount. The percentage overdue divides that overdue figure by the total. So changing the as-of date re-ages every invoice at once.
A worked aging example
Put a date on it and the logic is clear. Suppose you report as of 30 June, and an invoice for 4,200 was due on 25 May.
The days overdue are the days from 25 May to 30 June, which is 36. Because 36 falls between 31 and 60, the invoice lands in the 31-60 bracket. It counts toward your overdue total, not your current balance, and it nudges your percentage-overdue figure upward. So each invoice slots into exactly one bracket based on that single subtraction.
Reading the charts
The first chart shows the value of receivables in each aging bracket. Bars run from current on the left to 90-plus on the right, coloured from green to red.
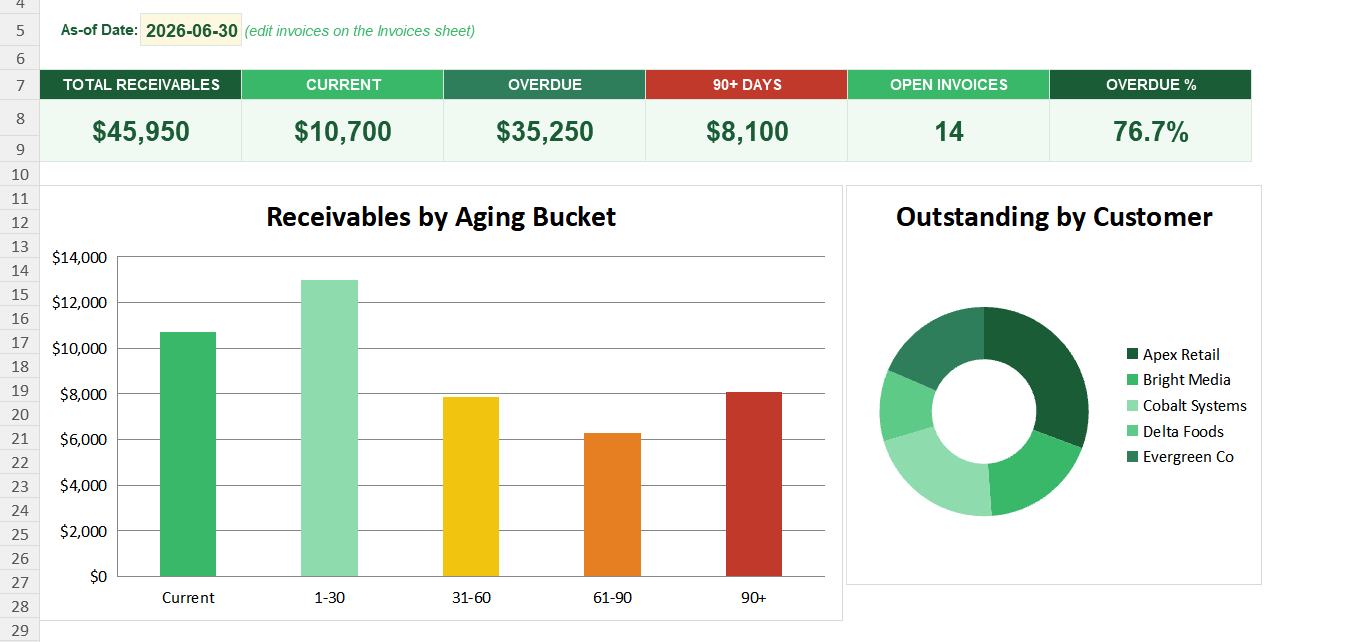
A tall red bar on the right is an urgent warning, because that money is at real risk. The second chart is a doughnut that splits the outstanding balance by customer, so you can see who owes the most. Because you see the age and the customer together, you know exactly whom to chase. So together the charts turn a receivables ledger into a collection plan.
Chase the oldest debts first. Money in the 90-plus bracket is the least likely to arrive, so a prompt call there protects the most cash.
Who uses an accounts receivable aging report
Finance and credit teams use it to manage collections and cash flow. It tells them which invoices to chase today.
Small business owners use it to protect their cash from slow payers. Bookkeepers use it to flag bad-debt risk. Credit controllers use it to set collection priorities. Because every business that invoices on credit carries receivables, the report suits many settings.
The template is a starting point, not a fixed form. You can add invoices as they build up. You can change the bracket ranges to match your payment terms.
The dashboard bends to your needs, so you can add a follow-up column to note when you last chased each invoice. A quick edit does it. You might also add a customer contact for quicker collection calls. The structure welcomes that kind of extension without complaint.
You cannot collect cash you cannot see slipping away. An accounts receivable aging report shows how overdue every invoice is and how much money sits at risk. So download the template, enter your invoices and an as-of date, and turn a static ledger into a plan to get paid.