Running a retail or supermarket business without a sales budget is like navigating without a map. Sales come in, costs go out, and at the end of the month it is hard to know whether the business performed well or poorly — unless you have a clear benchmark to compare against.
A sales budget solves this. It sets expected figures for income, cost of goods, and expenses before the period begins. Then it tracks what actually happened alongside those targets. Every gap becomes visible. Every overspend or underperformance shows up immediately.
This free Basic Sales Budget Template gives any retail business that system. Download it, fill in your figures, and know exactly where you stand.
Explore other Financial and Budgeting Excel Templates.
What Is the Basic Sales Budget Template?
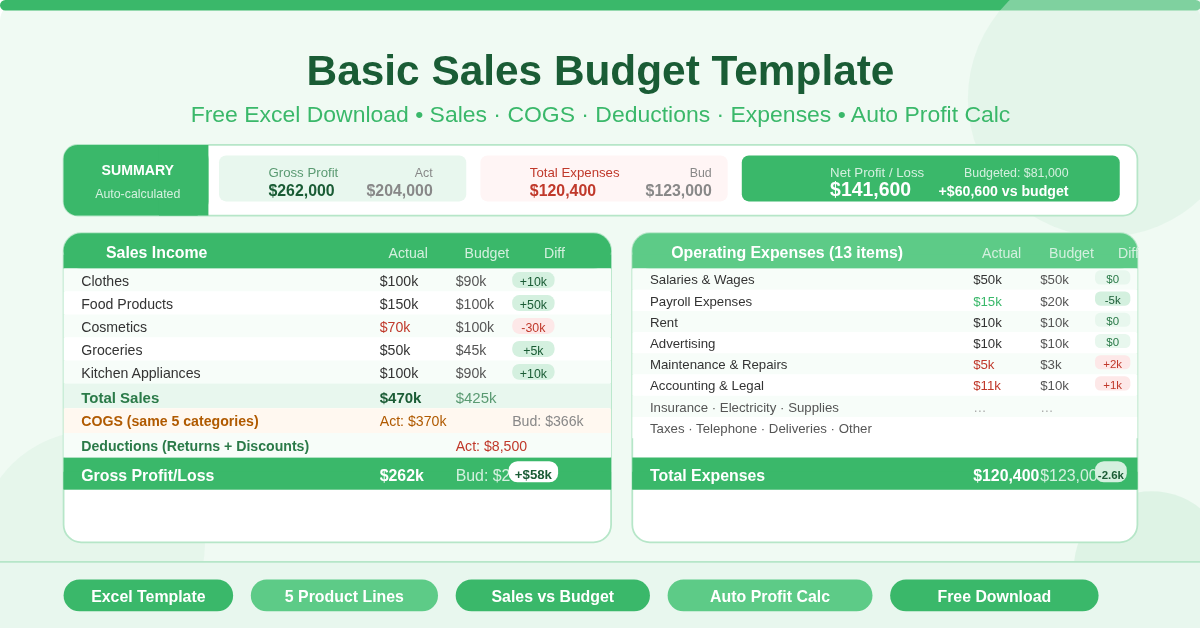
The template is a single-sheet Microsoft Excel workbook designed for supermarkets and retail businesses. Five product categories — Clothes, Food Products, Cosmetics, Groceries, and Kitchen Appliances — run through the entire budget as a consistent structure.
The Summary Section
Three key figures sit at the top of the sheet: Gross Profit, Total Expenses, and Net Profit/Loss. Each shows Actual, Budget, and Difference side by side. These auto-calculate from the detail sections below. At a glance, any manager can see whether the business made or lost money — and how it compared to the plan.
The Income Section
Sales figures appear for each of the five product categories. Actual and Budget columns sit alongside each other. The Difference column reveals which categories beat their sales targets and which fell short. Total Sales sums everything automatically.
Cost of Goods Sold
COGS appears for the same five product categories. Comparing actual COGS against the budget for each category reveals where procurement costs ran higher or lower than expected. Tight COGS management directly protects the gross margin.
Deductions
Two deduction types — Sales Returns and Discount Sales — reduce total revenue before gross profit is calculated. Tracking these separately matters. High sales returns may signal a quality or expectation problem. Excessive discounting can erode margins even when sales volumes look healthy.
Gross Profit
Gross Profit calculates automatically as Total Sales minus Total COGS minus Total Deductions. Both actual and budgeted gross profit appear, along with the difference between them. This is the most important income metric for any retail operation.
The Expenses Section
Twelve operating expense categories round out the budget. Each shows Actual versus Budget with an automatic Difference:
- Accounting and Legal
- Advertising
- Insurance
- Maintenance and Repairs
- Office Supplies
- Payroll Expenses
- Rent
- Electricity
- Salaries and Wages
- Taxes and Licenses
- Telephone
- Deliveries
- Other
Total Expenses sums all categories automatically. Subtracting this from Gross Profit gives the final Net Profit/Loss — the bottom-line figure every business owner needs.
Who Should Use This Template?
Supermarket owners and managers will find the five-category product structure immediately recognizable. The template maps directly to typical retail department splits — clothing, food, cosmetics, groceries, and appliances. Small retail businesses of any kind can adapt it quickly. Rename the five product categories to match your own product lines. The expense section applies universally across most retail operations. Finance teams in larger retail chains can use it as a department-level or store-level budget tool. Running one copy per store makes it easy to compare performance across locations without complex reporting systems.
How to Use the Template
Start by entering your business name, contact number, and address at the top of the sheet. Move to the Income section. Enter budgeted sales figures for each product category before the period begins. As the period closes, enter actual sales in the Actual column. Repeat this for the COGS section — budget your expected cost of goods, then enter actuals. Do the same for Deductions and each Expense category. The Summary section at the top updates automatically. Gross Profit, Total Expenses, and Net Profit/Loss all calculate without any extra steps.
How to Modify the Template
Rename the five product categories to match your own business. Replace “Clothes” or “Cosmetics” with whatever product lines you carry. Add new expense rows between the existing expense items and the Total Expenses row. The SUM formula picks up new rows automatically.
To track multiple periods, save a copy for each month or quarter. Over time, these copies build a performance archive — making it easy to spot seasonal trends and compare periods year over year.
Conclusion
The Basic Sales Budget Template gives retail businesses a clear, structured way to compare actual performance against targets. Sales, COGS, deductions, and 12 operating expenses all tracked in one place — with automatic gross and net profit calculations. Download it, customize the product categories, and start your next period with a solid financial plan in place.