Every business has costs. Wages, rent, supplies, advertising, taxes, insurance — they arrive every month whether planned for or not. The question is not whether those costs exist. The question is whether anyone in the organization knows in advance how much they will be, and whether the income coming in is enough to cover them.
A monthly company budget answers both questions before the month begins. It sets a financial plan — estimated income against estimated expenses — and then tracks what actually happens against that plan. The gap between estimated and actual is where every meaningful financial decision lives. Overspending on one line item might be fine if another came in under budget. A revenue shortfall is manageable if expenses also ran low. But none of these trade-offs are visible without a structured budget to compare against.
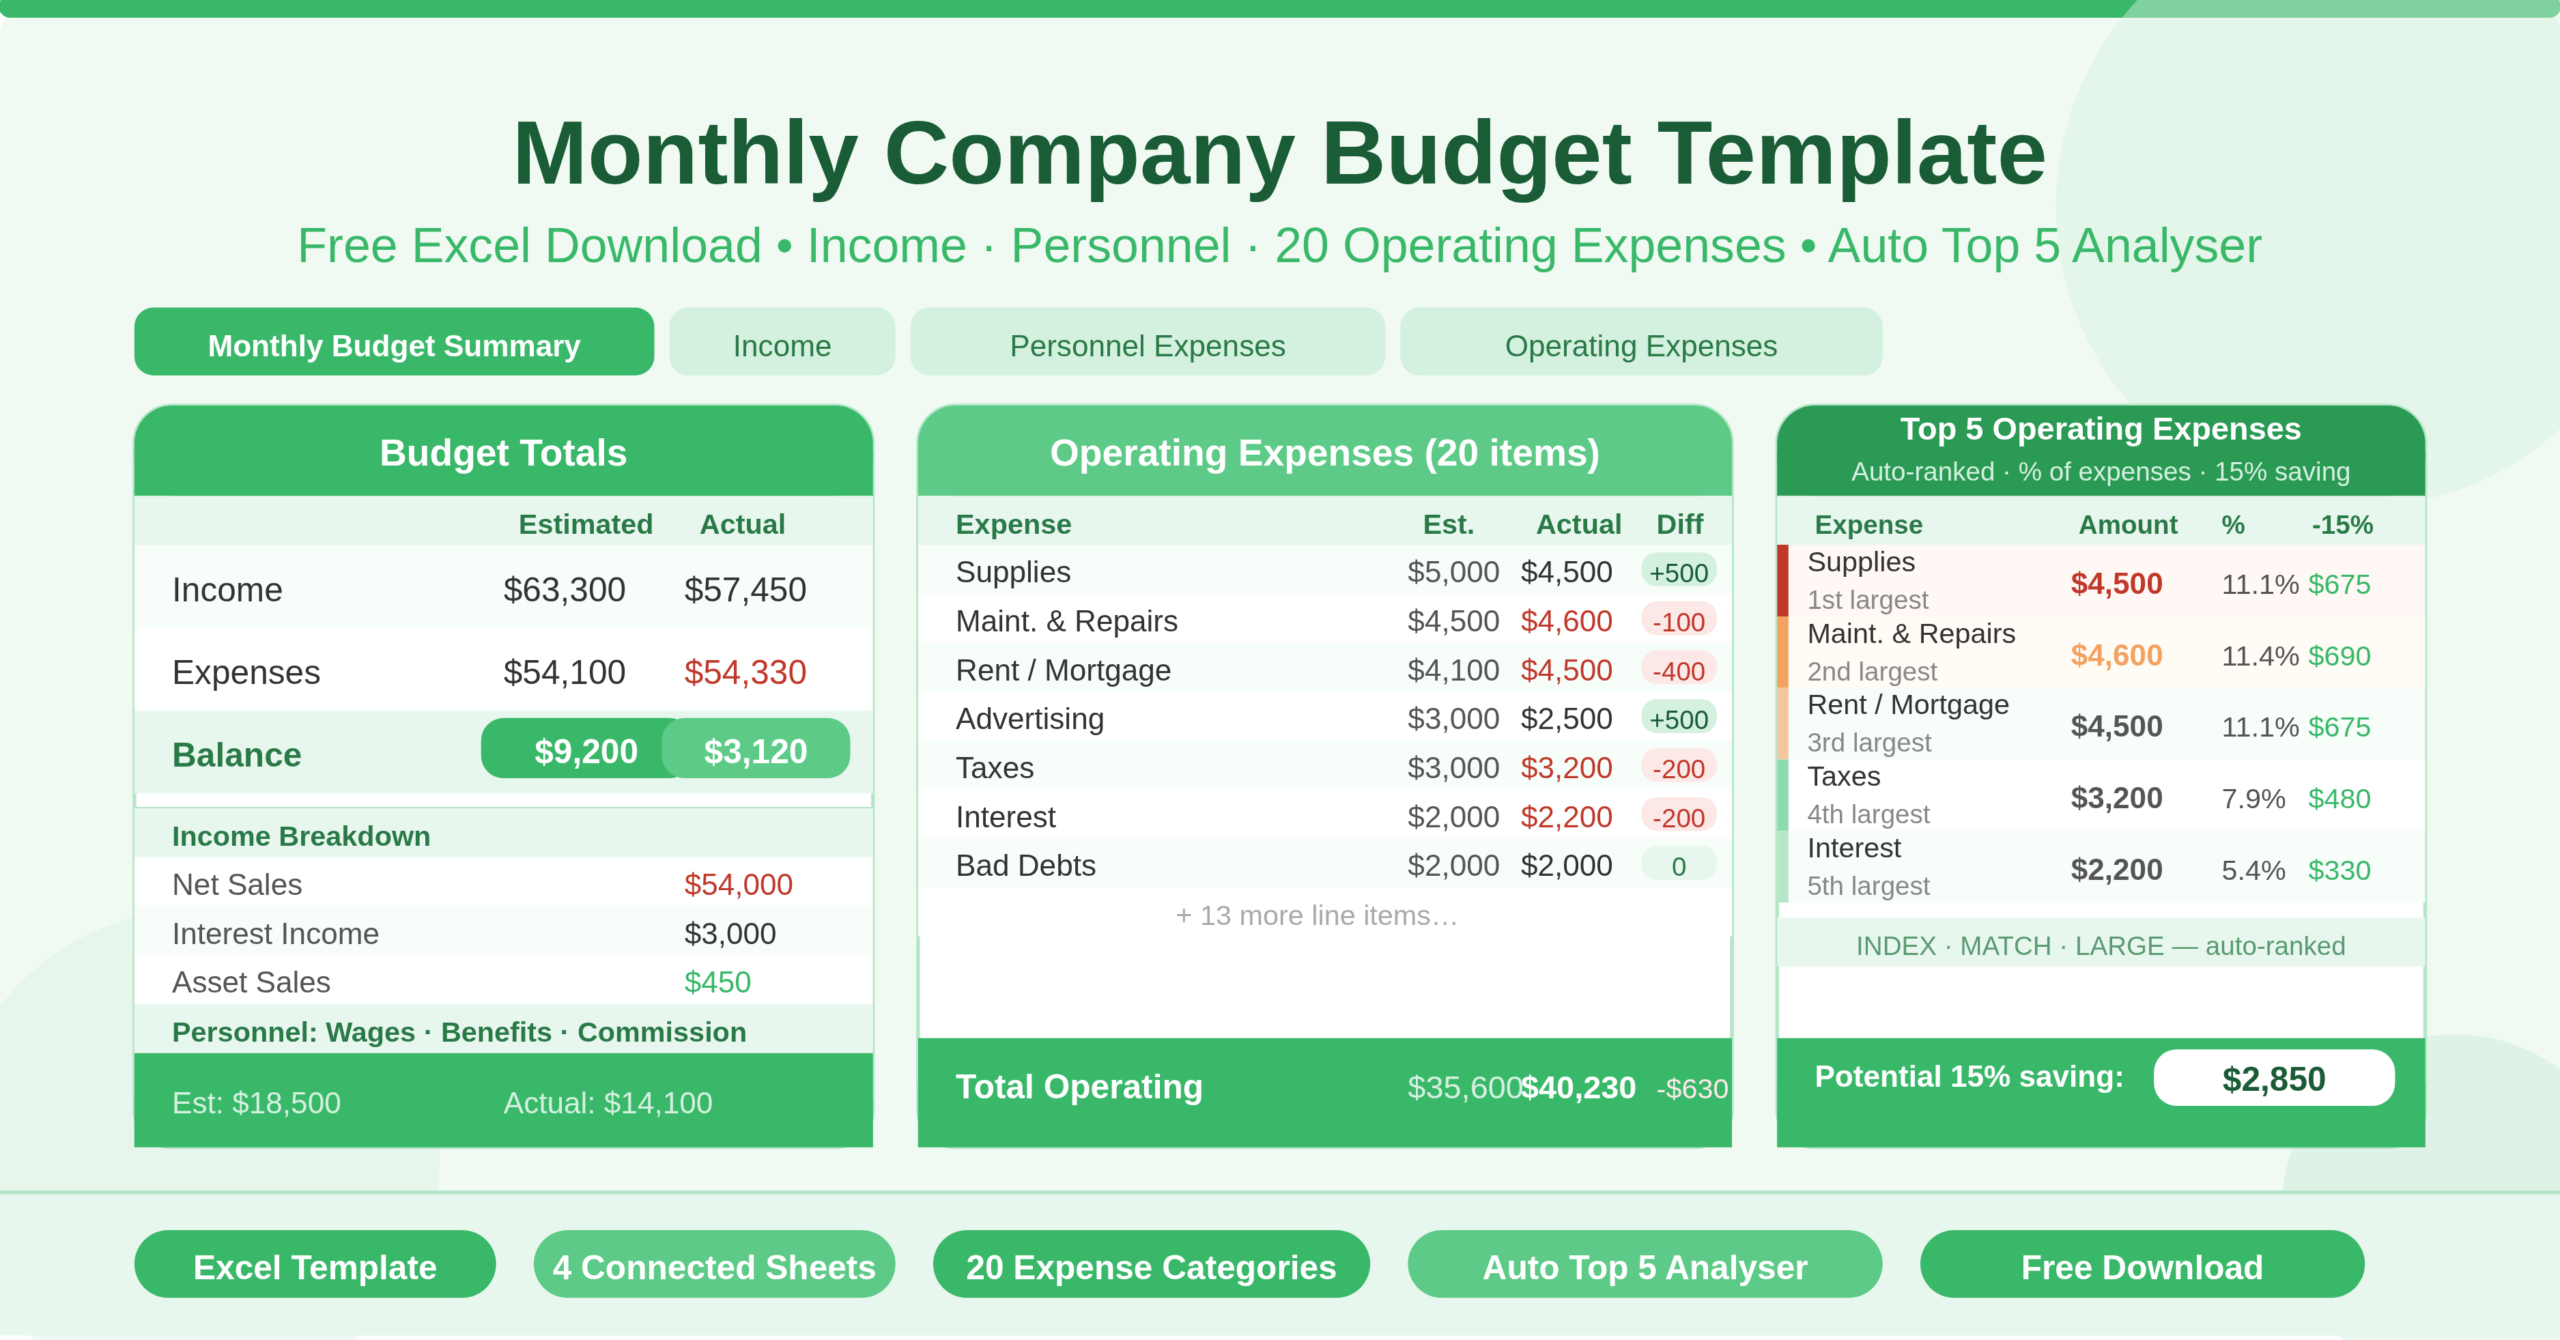
This free Excel Monthly Company Budget Template gives any business a professional, fully connected budgeting system. It covers income, personnel, and 20 categories of operating expenses — with automatic Top 5 expense analysis and a visual budget overview chart. Download it, enter your company name and figures, and start the month with a clear financial plan in place.
Explore other financial and budgeting Excel Templates.
What Is the Monthly Company Budget Template?
The Monthly Company Budget Template is a four-sheet Microsoft Excel workbook that gives businesses a complete monthly financial planning and tracking system. All four sheets connect through named ranges and structured Excel table references, so data entered in any sheet updates the summary and analysis automatically.
The Monthly Budget Summary sheet is the command center. It shows estimated and actual totals for income and expenses side by side, calculates the monthly balance — income minus expenses — for both projected and actual figures, and presents a visual budget overview chart. Below the chart sits the standout analytical feature of the template: a Top 5 Highest Operating Expenses table that automatically identifies which five operating costs are consuming the most budget, shows each as a percentage of total expenses, and calculates what a 15% reduction in each would save. This table uses INDEX and MATCH formulas combined with LARGE to rank expenses dynamically — no manual sorting required.
The Income sheet tracks three revenue streams: Net Sales, Interest Income, and Asset Sales (Gain/Loss). Each row captures estimated and actual figures, calculates the difference, and feeds into the summary sheet totals automatically.
The Personnel Expenses sheet covers the three core people costs: Wages, Employee Benefits, and Commission. Each line compares estimated against actual and calculates the variance. Personnel expenses roll into the total expenses figure on the summary sheet alongside operating costs.
The Operating Expenses sheet is the most detailed sheet, covering 20 individual expense categories: Advertising, Bad Debts, Cash Discounts, Delivery Costs, Depreciation, Dues and Subscriptions, Insurance, Interest, Legal and Auditing, Maintenance and Repairs, Office Supplies, Postage, Rent or Mortgage, Sales Expenses, Delivery and Storage, Supplies, Taxes, Telephone, Utilities, and Other. Every row tracks estimated versus actual and feeds the Top 5 analysis on the summary sheet.
Who Can Use This Template?
This template suits any business that wants a structured, professional approach to monthly financial tracking. Small and medium-sized businesses that manage their own finances without a dedicated finance team will find it immediately practical. The four-sheet structure separates income, people costs, and operational costs cleanly — giving owners and managers a clear view of each component of their monthly financial performance.
Finance managers and accountants in larger organizations can use it as a working budget model for a specific department, cost center, or project. The estimated versus actual framework and the automatic Top 5 analysis make it useful for both planning and reviewing.
Start-ups building their first formal budget will find the 20 pre-built operating expense categories an invaluable starting point. Rather than trying to anticipate every cost from scratch, the template provides a comprehensive checklist of business expenses to work through. Most businesses will recognize the vast majority of categories immediately.
Accountants and bookkeepers supporting business clients can use it as a client-facing budget document. The company name field at the top of each sheet and the clean, professional layout make it suitable for sharing with clients or presenting in management meetings.
Key Features of the Monthly Company Budget Template
The automatic Top 5 Operating Expenses analyzer is the feature that sets this template apart from basic budget spreadsheets. Using LARGE, INDEX, and MATCH formulas, it dynamically identifies the five highest actual operating expenses every time you update the Operating Expenses sheet. For each of the five expenses, it shows the amount, the percentage of total expenses it represents, and what saving 15% on that item would deliver in dollar terms. This analysis updates automatically — no manual sorting or formula editing required. It gives business owners an instant picture of where the biggest cost reduction opportunities sit.
The three-way estimated vs actual vs difference structure runs consistently across all four sheets. Every income and expense line shows what was planned, what actually happened, and the variance between the two. This consistency makes the template easy to use and easy to read — you always know what each column means regardless of which sheet you are on.
The automatic balance calculation on the Monthly Budget Summary sheet subtracts total expenses from total income for both estimated and actual figures. It then shows the difference between the two balances — revealing whether the month performed better or worse than the financial plan. These three figures — Estimated Balance, Actual Balance, and Difference — give any business owner or finance manager the complete monthly picture in a single glance.
The budget overview chart on the Monthly Budget Summary visualizes the financial performance of the month. Seeing income and expenses represented visually alongside each other makes it immediately clear whether the business is operating with a healthy margin or whether costs are pressing against revenue.
The SUBTOTAL formula in every total row across all sheets respects table filters. Apply a filter to the Operating Expenses sheet to focus on specific cost categories and the total row updates to reflect only the visible rows. This makes filtered cost analysis instant and accurate.
The named range architecture connects the company name and budget title across all four sheets. Update the company name on the Summary sheet and it propagates to the header of every other sheet automatically — a small but professional detail that matters when sharing the workbook with stakeholders.
The 20 operating expense categories cover the full range of typical business costs. From the fixed costs like Rent, Insurance, and Wages to variable costs like Advertising, Supplies, and Sales Expenses, the template provides a comprehensive starting framework for almost any business. The Other category provides a catch-all for any cost that does not fit the existing list.
How to Use the Monthly Company Budget Template
- Start by entering your company name in the designated field on the Monthly Budget Summary sheet. The name will populate automatically across all other sheets. Add the budget date to complete the header.
- Next, open the Income sheet. Enter your estimated revenue for the month in the Estimated column for each income source — Net Sales, Interest Income, and Asset Sales. At the start of the month, these are your revenue targets. As the month progresses, enter actual income received in the Actual column. The Difference column calculates automatically.
- Move to the Personnel Expenses sheet. Enter estimated wages, employee benefits, and commission for the month. Update the Actual column as payroll is processed and commission is paid out.
- Open the Operating Expenses sheet and work through all 20 categories. For each relevant expense, enter the estimated amount in the Estimated column. At the end of the month — or as invoices and payments are processed throughout the month — enter actual amounts in the Actual column.
- Return to the Monthly Budget Summary sheet to review overall performance. The Income, Expenses, and Balance rows update automatically from all three detail sheets. Review the Top 5 Operating Expenses table to see which costs are consuming the largest share of your budget. Use the 15% Reduction column to prioritise which costs to negotiate, reduce, or cut in the following month.
How to Modify the Template
The template adapts easily to businesses of any size and structure. To add new income streams, insert rows in the Income sheet between the existing income rows and the Total row. The SUBTOTAL formula in the Total row automatically includes new rows added within the table range.
To add new operating expense categories, insert new rows in the Operating Expenses sheet between existing expense rows and the Total row. The new rows feed into the Top 5 analysis on the summary sheet automatically — if any new expense is large enough to rank in the top five, it will appear there without any formula changes.
To add more personnel expense types — for example, contractor fees, training costs, or recruitment expenses — insert new rows in the Personnel Expenses sheet and follow the same pattern as existing rows.
To change the Top 5 analysis to a Top 3 or Top 10, adjust the number of rows in the Top 5 table on the Monthly Budget Summary sheet. Fewer rows narrow the focus to the most critical costs; more rows give a broader picture of cost concentration.
To track budgets across multiple months, duplicate the workbook at the start of each month. Name each copy with the month and year. After twelve months, you have a full-year archive of monthly budgets. Create a thirteenth workbook as an annual summary that references the monthly totals from each file — delivering a consolidated year-end financial view without any manual data compilation.
Advanced users can build a rolling 12-month dashboard by linking all monthly workbooks into a master tracker. A SUMIF or INDIRECT formula structure can pull income and expense totals from each monthly file into a single annual view, enabling trend analysis and year-over-year comparisons.
Why Every Business Needs a Monthly Budget
Cash flow is the most common reason small businesses fail — not profitability, but the timing mismatch between money coming in and money going out. A monthly budget does not eliminate that risk, but it makes it visible in advance. When you can see that next month’s estimated expenses exceed estimated income, you have time to act — delay a purchase, accelerate a payment collection, or draw on a credit facility. Without a budget, that visibility only comes after the bank account is already under pressure.
The Top 5 expense analysis is particularly valuable for businesses looking to improve margins without cutting headcount. Operating expenses often contain costs that have crept up over time — subscriptions renewed without review, supplier rates that have not been renegotiated, service agreements that have expanded beyond their original scope. Seeing the top five costs ranked by size, with a 15% reduction target calculated automatically, turns a vague intention to reduce costs into a specific, actionable target.
The estimated versus actual framework also builds financial discipline over time. In the first month of using a budget, estimates are often rough. After six months of tracking actuals against estimates, most businesses develop a much more accurate picture of their true cost base. That accuracy improves planning, reduces financial surprises, and supports better decisions about growth, investment, and hiring.
Conclusion
The Monthly Company Budget Template is a professional, well-engineered Excel budgeting tool that any business can start using immediately. It tracks income and expenses across three detailed sheets, calculates the monthly balance automatically, and delivers intelligent cost analysis through the automatic Top 5 Operating Expenses table. With 20 operating expense categories, named range connectivity across all sheets, and a built-in budget overview chart, it covers every element of a complete monthly business budget. Download it, enter your company details and figures, and give your business the financial visibility it needs to operate with confidence every month.