Most businesses track sales figures. Fewer track those figures against targets, broken down by region, measured month-to-date and year-to-date, benchmarked against competitors, and supported by balance sheet and operating metric data — all in one document.
That level of visibility is what separates reactive businesses from proactive ones. When every dimension of performance is visible in a single report, leadership teams make faster, better-informed decisions.
This free Sales Budget Summary Template delivers exactly that. Three connected sheets. Four reporting sections. Automatic variance calculations. Download it and transform your monthly reporting.
Explore other Financial and Budgeting Excel Templates.
What Is the Sales Budget Summary Template?
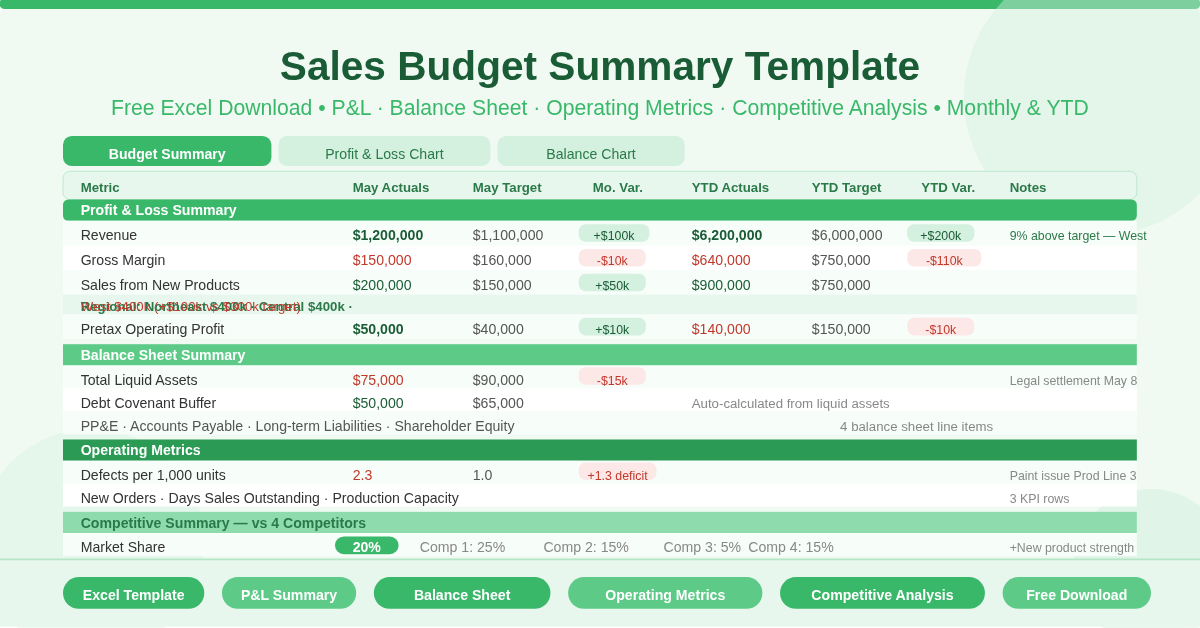
The template is a three-sheet Microsoft Excel workbook built for management-level sales performance reporting. The main Budget Summary sheet contains four distinct reporting tables. Two supporting chart sheets — Profit & Loss Chart and Balance Chart — visualize the numbers automatically.
Every table follows the same six-column structure: May Actuals, May Targets, Monthly Variance, YTD Actuals, YTD Targets, and YTD Variance. A Notes column sits alongside each section for commentary. This dual monthly-and-YTD view means leadership sees both the current month snapshot and the cumulative picture in a single glance.
Section 1 — Profit and Loss Summary
The P&L section is the core of the report. It covers:
- Revenue — Total revenue with monthly and YTD actuals vs targets. A pre-filled note reads: “We exceeded our May revenue target by 9%, due to stronger execution in the West region.” This shows how the Notes column supports narrative alongside data.
- Gross Margin and Gross Margin % — Both the dollar amount and percentage are tracked separately. Percentage is auto-calculated as gross margin divided by revenue. Variance flags immediately when margin compresses even if revenue grows.
- Sales from New Products — A dedicated row tracks new product revenue independently. This gives product and sales teams visibility without burying the figure in total revenue.
- Regional Sales Breakdown — Three regions — Northeast, Central, and West — each have their own row. Monthly and YTD figures appear for each. Regional variances reveal which territories are driving performance and which need intervention.
- SG&A Expenses, Pretax Operating Profit, and Operating Margin — The bottom of the P&L section rounds out the income view. Operating margin auto-calculates as operating profit divided by revenue.
- P&L Chart Sheet – A dedicated Profit & Loss Chart sheet visualizes actuals vs targets for both the month and year-to-date. It links directly to the Budget Summary sheet — update any figure and the chart refreshes automatically.
Section 2 — Balance Sheet Summary
The balance sheet section tracks financial position alongside P&L performance. Six items appear:
- Liquid Assets — Period-end cash flow, accounts receivable, and inventory combine into total liquid assets. A note on cash flow reads: “Cash flow differential was due to cash settlement of legal dispute on May 8.” These notes are exactly the kind of context that makes management reports useful.
- Debt Covenant Buffer — Total liquid assets minus assets required by debt covenants. This auto-calculates and flags any breach risk immediately. No manual arithmetic needed.
- Other Balance Sheet Items — Property, plant and equipment, accounts payable, long-term liabilities, and shareholder equity each have dedicated rows with monthly and YTD views.
- Balance Chart Sheet – A second chart sheet — Balance Chart — visualizes monthly actuals vs targets for all balance sheet items. Like the P&L chart, it links directly to the summary data.
Section 3 — Operating Metrics Summary
Four operational KPIs appear here, each with monthly and YTD tracking:
- Defects per 1,000 widgets — Quality performance against a target of 1.0. The May actual of 2.3 is flagged with a root-cause note.
- Production capacity — Units per month against a production target.
- Days of sales outstanding — Receivables efficiency. May actual of 35 days versus a 25-day target highlights a collection issue.
- Number of new orders — Sales pipeline health. 19 orders in May against a target of 15.
Section 4 — Competitive Summary
The final section benchmarks the company against four named competitors across three dimensions: market share, YTD revenue, new product introductions, and estimated field salespeople.
Your company’s figures sit in the first column. Competitor columns sit alongside. This side-by-side layout makes competitive positioning immediately readable — no switching between documents.
Who Should Use This Template?
Sales directors and VP-level managers who present monthly performance to boards or executive teams will find it ready to use with minimal setup. Finance business partners supporting sales functions can use it to consolidate regional and product-level data into a single coherent report.
Any business that wants to move beyond basic sales tracking — and start benchmarking performance against targets, tracking competitive position, and monitoring operational health — will find this template a significant upgrade.
How to Use the Template
Enter your company name at the top of the Budget Summary sheet. Fill in May Actuals and May Targets for each row in all four sections. Update YTD figures as the year progresses. Add narrative to the Notes column for any significant variances.
The variance columns calculate automatically. The chart sheets update as soon as figures are entered. Gray cells throughout the sheet calculate for you — the template notes these should not be altered.
Conclusion
The Sales Budget Summary Template is a professional, executive-ready reporting tool that goes far beyond a basic sales tracker. Monthly and YTD performance, balance sheet health, operational KPIs, and competitive benchmarking — all in one workbook, with automatic charts. Download it and give your management reporting the structure and depth it deserves.