Sales teams spend money to make money. Travel, events, commissions, advertising, staff utilities — each cost is necessary, but together they can grow faster than revenue if nobody is watching them closely.
A sales expense budget gives you that visibility. Set your targets at the start of the period. Track actuals as costs arrive. The difference column tells you immediately which expenses are running over plan. That clarity makes the difference between a sales team that controls its cost base and one that discovers overruns at month-end.
This free Sales Expense Budget Template is clean, focused, and ready to use in minutes.
Explore other Financial and Budgeting Excel Templates.
What Is the Sales Expense Budget Template?
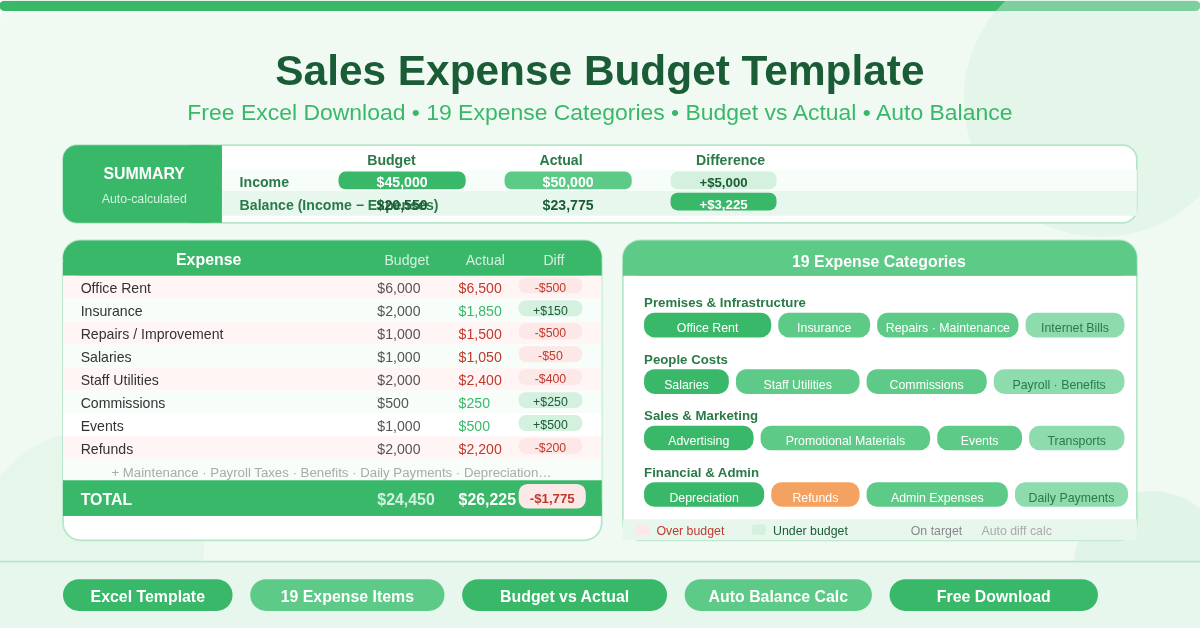
The template is a single-sheet Microsoft Excel workbook. It covers three things: a Summary panel at the top, a detailed Expenses table in the middle, and automatic totals throughout.
The Summary Panel
Three rows sit at the top of the sheet — Income, Expenses, and Balance. Each shows Budget, Actual, and Difference side by side.
Income holds your projected and actual revenue for the period. Total Expenses pulls automatically from the expenses table below. Balance subtracts expenses from income for both budget and actual figures. This gives any manager an instant financial snapshot without scrolling through the detail.
The Expenses Table
Nineteen expense categories make up the core of the template. Budget and Actual columns sit alongside each other. A Difference column shows the gap for every line — positive means under budget, negative means over.
The 19 Expense Categories
The template covers the full range of costs typical for a sales operation:
Premises and Infrastructure
- Office Rent
- Insurance
- Repairs and Improvements
- Maintenance
- Internet Bills
People Costs
- Salaries
- Staff Utilities
- Commissions
- Payroll Taxes
- Benefits
- Daily Payments
Sales and Marketing
- Advertising
- Promotional Materials
- Events
- Transports
Financial and Administrative
- Depreciation
- Refunds
- Administration Expenses
- Others
Each category has its own budget and actual fields. The Total row at the bottom sums all 19 categories using a SUM formula. Update any figure and every total adjusts instantly.
Who Should Use This Template?
Sales managers tracking departmental spend against a monthly or quarterly budget will find it immediately practical. The 19 categories map closely to real sales operation costs — from office rent to event expenses to refunds.
Small business owners who run their own sales function will appreciate the simplicity. There is no complexity to navigate and no setup required. Enter your budget figures, then update actuals as costs are incurred.
Finance teams supporting sales departments can use it as a reporting tool. The Budget vs Actual structure with a clear Difference column makes variance analysis fast.
Startups planning their first formal sales budget will find the 19 pre-built categories a useful checklist. Most of the line items will appear in any sales operation within the first few months of trading.
How to Use the Template
Start by entering your income figures in the Summary panel. Add the budgeted revenue in the Budget column and your projected or actual income in the Actual column.
Move to the Expenses table. Work through each of the 19 categories and enter your budgeted amount in the Budget column. Do this before the period begins to set your spending plan.
As the period progresses, enter actual costs in the Actual column for each category. The Difference column updates immediately for every row. The Total row at the bottom and the Summary panel at the top both reflect every change in real time.
Review the Difference column regularly. Categories with consistently negative differences are costing more than planned. Address these early — before the period ends and the budget is already broken.
How to Modify the Template
Rename any expense category by clicking on the cell and typing a new label. Formulas reference column positions, not labels, so renaming never breaks calculations.
Add new expense categories by inserting rows between existing items and the Total row. The SUM formula expands to include them automatically.
Remove unused categories by deleting their rows. The totals adjust without any manual formula updates.
To track multiple periods, save a copy for each month or quarter with a date in the filename. Over time these copies reveal spending trends — categories that creep up gradually, seasonal cost spikes, or expenses that consistently beat their budget targets.
Conclusion
The Sales Expense Budget Template gives any sales team or small business a clear, structured way to track costs against a plan. Nineteen categories, automatic totals, a live summary panel, and budget vs actual differences on every row. Download it, enter your figures, and keep your sales costs exactly where they should be.