
Engagement surveys are easy to run and hard to act on. The results land in a spreadsheet, sit there, and quietly change nothing.
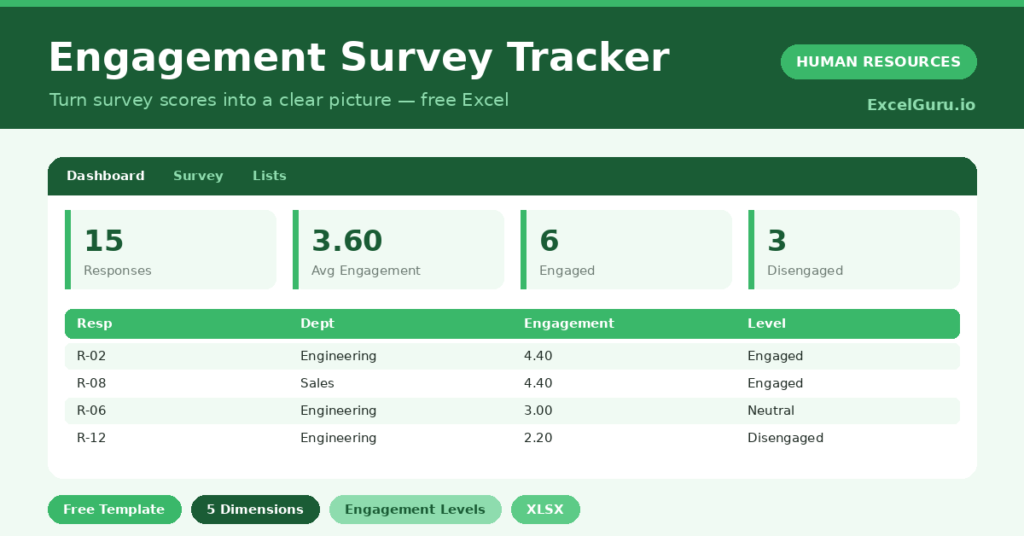
This free engagement tracker turns scores into direction. You enter responses across five areas, and the sheet shows where you are strong and weak. You will also find realistic sample data already inside the file. Therefore, you can explore every formula, dropdown and chart first, and then replace the samples with your own records in minutes.
Below, we explain the dimensions, the formulas, and how to adapt the tracker to your own survey.
What Is an Engagement Survey Tracker?
An engagement survey tracker records how employees rate their experience across several dimensions. It turns raw scores into a single engagement measure. That one number makes it easy to compare teams and watch the trend.
It then classifies each response and averages each dimension. As a result, you can see both the headline and the detail behind it. Each dimension sits on its own, so a strong overall score never hides a weak spot underneath.
Why Does Engagement Matter?
Engaged employees stay longer, work harder and serve customers better. Disengagement, left unseen, quietly drains performance and retention. It rarely announces itself, which is exactly why measuring it matters so much.
A clear tracker makes engagement measurable. Therefore, you can target the weakest area rather than guessing. Tracking it over time also shows whether your actions are working.
Why Use This Template?
A clear tracker turns a survey into action. In particular, this one helps you:
- Score five engagement dimensions.
- Calculate an engagement score per response.
- Classify staff as engaged, neutral or disengaged.
- See your strongest and weakest dimensions.
- Focus action where it matters most.
What’s Inside the Template?
The workbook has four tabs:
- How to Use — a built-in guide.
- Dashboard — engagement levels and dimension averages.
- Survey — one row per response.
- Lists — the department dropdown and scale.
What Formulas Does the Template Use?
The tracker uses dependable Excel formulas:
| Formula | What it does |
| =AVERAGE(Satisfaction:Work-Life) | Calculates the engagement score per response. |
| =IF(Score>=4,”Engaged”,…) | Classifies the engagement level. |
| =COUNTIF(Level,”Engaged”) | Counts engaged responses. |
| =AVERAGE(dimension column) | Calculates the average for each dimension. |
| =COUNTIF(Level,”Engaged”) / Responses | Calculates the engaged percentage. |
How Do You Use the Template?
The tracker is quick to use. Just follow these steps:
- Open the Survey tab and add each response.
- Enter scores from 1 to 5 for each dimension.
- Let the engagement score and level calculate.
- Read the dimension averages on the Dashboard.
- Find your weakest dimension.
- Plan a visible action to improve it.
What Are the Best Use Cases?
The tracker fits many teams, such as:
- HR teams running engagement surveys.
- Managers checking their team’s morale.
- Leadership tracking culture over time.
- People teams targeting retention.
- Anyone turning survey data into action.
How Can You Modify the Template?
You can tailor it freely. To change the dimensions, rename the five score columns to match your questions.
You can also add a comments column to capture qualitative feedback alongside the scores.
Moreover, the sheet covers 40 responses by default, and you can copy the formula row downward for more.
What Mistakes Should You Avoid?
A few habits weaken the tracker. Therefore, avoid these common mistakes:
- Collecting responses that are not anonymous.
- Surveying often but never acting.
- Focusing on the average and ignoring the spread.
- Comparing scores from differently worded surveys.
Tips to Get the Most From It
- Keep responses anonymous for honesty.
- Act visibly on the weakest dimension.
- Survey on a regular rhythm to see the trend.
- Share results openly to build trust.
Frequently Asked Questions
How is the engagement score calculated?
It averages the five dimension scores for each response. The result then classifies the person as engaged, neutral or disengaged.
Why keep responses anonymous?
Anonymity encourages honest answers, especially on sensitive topics like management. Honest data is the only kind worth acting on.
What should I do with the weakest dimension?
Make it your focus. A visible action on the lowest-scoring area shows staff the survey leads to change, which improves future participation.
Can I track engagement over time?
Yes. Keep a copy of each survey round and compare the averages to see whether engagement is improving.
Does it work in Google Sheets?
It does, with minor adjustments to formatting after importing.
Download the Template and Get Started
A survey is only as good as what you do next. This tracker turns engagement scores into a clear place to act.
Download the Engagement Survey Tracker and listen to your team today.