
HR runs on numbers, yet they often live in a dozen places. When leadership asks how people metrics are tracking, the answer takes a week to assemble.
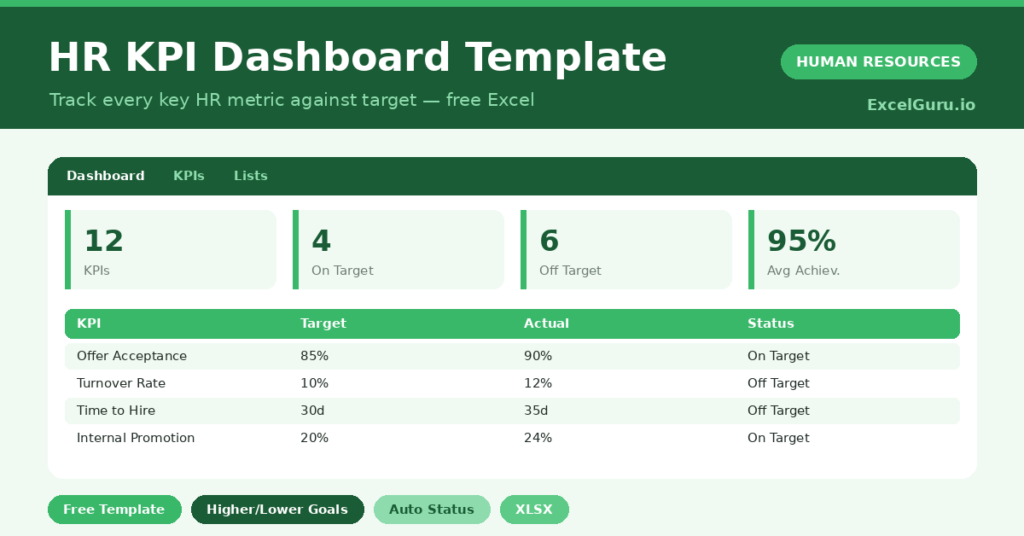
This free HR KPI dashboard brings them together. You set targets and actuals, and the sheet scores each metric and flags its status. You will also find realistic sample data already inside the file. Therefore, you can explore every formula, dropdown and chart first, and then replace the samples with your own records in minutes.
Below, we explain the formulas, the workflow, and how to adapt the dashboard to your own metrics.
What Is an HR KPI Dashboard?
An HR KPI dashboard tracks your key people metrics against their targets in one place. It covers retention, recruitment, engagement and cost.
It then scores each metric and flags whether it is on target. As a result, you get a single, honest view of how HR is performing.
Why Does an HR Dashboard Matter?
Scattered metrics make it hard to see the whole picture or to act with confidence. Important signals get lost in separate spreadsheets.
A single dashboard fixes that. Therefore, you can brief leadership quickly and focus on the metrics that are off track. It also keeps the team honest by putting every number against a clear target.
Why Use This Template?
A clear dashboard turns scattered metrics into focus. In particular, this one helps you:
- Track every key HR metric in one view.
- Score achievement against target.
- Handle higher-is-better and lower-is-better goals.
- Flag each metric as on, near or off target.
- Brief leadership in minutes, not days.
What’s Inside the Template?
The workbook has four tabs:
- How to Use — a built-in guide.
- Dashboard — status and achievement KPIs.
- KPIs — one row per metric.
- Lists — category and direction dropdowns.
What Formulas Does the Template Use?
The dashboard uses dependable Excel formulas:
| Formula | What it does |
| =IF(Direction=”Higher”, Actual/Target, Target/Actual) | Calculates achievement for either goal direction. |
| =IF(Achievement>=1,”On Target”,…) | Flags the status of each metric. |
| =COUNTIF(Status,”On Target”) | Counts metrics on target. |
| =AVERAGEIF(Achievement,”>0″) | Calculates average achievement. |
| =COUNTIF(Status,”On Target”) / Total | Calculates the on-target percentage. |
How Do You Use the Template?
The dashboard is quick to run. Just follow these steps:
- Open the KPIs tab and list your metrics.
- Set whether higher or lower is better for each.
- Enter the target and the actual value.
- Let achievement and status calculate.
- Review the off-target metrics first.
- See the overall picture on the Dashboard.
What Are the Best Use Cases?
The dashboard fits many teams, such as:
- HR leaders reporting to the board.
- People teams tracking quarterly goals.
- Founders watching key people metrics.
- Managers reviewing their function.
- Anyone consolidating scattered HR numbers.
How Can You Modify the Template?
You can tailor it freely. To change the metrics, simply edit the KPI list to match your priorities.
You can also adjust the near-target threshold to set a tighter or looser warning band.
Moreover, the sheet covers 30 metrics by default, and you can copy the formula row downward for more.
What Mistakes Should You Avoid?
A few habits weaken the dashboard. Therefore, avoid these common mistakes:
- Setting the wrong direction for a metric.
- Tracking so many KPIs that focus is lost.
- Choosing targets with no real basis.
- Reviewing the dashboard but never acting.
Tips to Get the Most From It
- Pick a focused set of metrics that matter.
- Set the direction carefully for each one.
- Review off-target metrics in every people meeting.
- Refresh the actuals on a regular rhythm.
Frequently Asked Questions
How does achievement handle different goals?
For higher-is-better metrics it divides actual by target; for lower-is-better metrics it divides target by actual. Either way, one or more means on target.
Which metrics should I track?
Choose a focused set that reflects your priorities, such as turnover, time to hire, engagement and cost. Fewer, well-chosen metrics beat a long, unread list.
What does Near Target mean?
It means a metric is close to its target, within the warning band. It is a prompt to watch the metric before it slips off target.
Can I change the targets?
Yes. Set targets that are realistic and grounded in your own history or benchmarks, and the achievement and status update automatically.
Does it work in Google Sheets?
It does, with minor adjustments to formatting after importing.
Download the Template and Get Started
Good people decisions start with a clear view of the numbers. This dashboard puts every key metric in one place.
Download the HR KPI Dashboard Template and see your people metrics today.