Not all stock deserves equal attention. A handful of items usually ties up most of your money, while a long tail barely matters.
This free ABC analysis template finds that split for you. You enter usage and cost, and the sheet ranks every item and assigns a class automatically. You will also find realistic sample data already inside the file. Therefore, you can explore every formula, dropdown and chart first, and then replace the samples with your own records in minutes.
Below, we explain the method, the formulas, and how to adapt the analysis to your own catalogue.
What Is ABC Analysis?
ABC analysis sorts inventory into three classes by annual consumption value. Class A holds the vital few, while Class C holds the trivial many.
The idea follows the Pareto principle, where a small share of items drives most of the value. As a result, you can match your effort to what each item is truly worth.
Why Does ABC Analysis Matter?
Time and control are limited, so spreading them evenly wastes both. Counting a cheap washer as carefully as a costly motor makes no sense.
ABC analysis tells you where tight control pays off. Therefore, you can count and protect Class A items closely while keeping Class C simple. Consequently, you reduce risk and effort at the same time.
Why Use This Template?
A clear classification sharpens every stock decision. In particular, this one helps you:
- Rank every item by its annual value.
- Assign A, B and C classes automatically.
- See how much value each class represents.
- Focus counting and control where they matter.
- Decide where to cut safety stock safely.
What’s Inside the Template?
The workbook has four tabs:
- How to Use — a built-in guide.
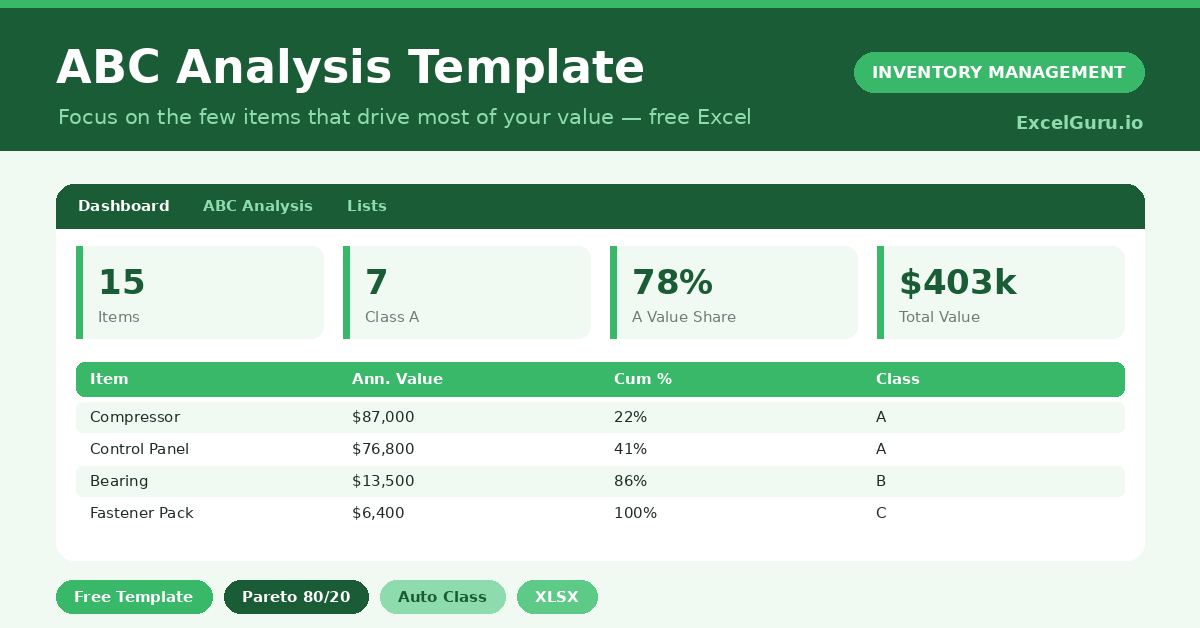
- Dashboard — items and value by class.
- ABC Analysis — the working sheet, one row per item.
- Lists — the classification reference notes.
What Formulas Does the Template Use?
The analysis uses dependable Excel formulas:
| Formula | What it does |
| =Annual Usage * Unit Cost | Calculates each item’s annual value. |
| =Annual Value / Total Value | Calculates each item’s share of value. |
| =SUMIF(Value,”>=”&Value)/Total | Calculates cumulative share without sorting. |
| =IF(Cum<=80%,”A”,IF(<=95%,”B”,”C”)) | Assigns the ABC class. |
| =SUMIF(Class,”A”,Annual Value) | Totals the value held by Class A. |
How Do You Use the Template?
The analysis builds itself from two inputs. Just follow these steps:
- Open the ABC Analysis tab and list your items.
- Enter the annual usage for each item.
- Enter the unit cost in the amber column.
- Let value, share, cumulative share and class calculate.
- Read the class beside each item.
- Review the class split on the Dashboard.
What Are the Best Use Cases?
The template fits many businesses, such as:
- Retailers prioritising high-value lines.
- Manufacturers controlling key components.
- Warehouses planning cycle-count frequency.
- Buyers focusing negotiations on big spend.
- Finance teams reviewing where cash sits.
How Can You Modify the Template?
You can adjust it easily. To change the thresholds, edit the 80 percent and 95 percent figures in the Class formula to fit your policy.
You can also swap annual usage for forecast demand if you prefer a forward-looking view.
Moreover, the sheet covers 40 items by default, and you can copy the formulas down for a larger catalogue.
What Mistakes Should You Avoid?
A few habits distort the analysis. Therefore, avoid these common mistakes:
- Using price alone instead of annual value.
- Forgetting to update usage as demand shifts.
- Treating Class C as worthless rather than low-priority.
- Running it once and never revisiting the classes.
Tips to Get the Most From It
- Refresh the analysis each quarter as demand changes.
- Count Class A items most often and Class C least.
- Negotiate hardest on Class A spend.
- Use the value-by-class chart to brief your team quickly.
Frequently Asked Questions
How does the template classify without sorting?
It compares each item’s value to the rest using a cumulative-share formula. Therefore, the class is correct even when the list is in any order.
What share should each class hold?
A common split is 80, 15 and 5 percent of value for A, B and C. You can change the thresholds to match your own policy.
Should I ignore Class C items?
No. Class C simply needs less control, not none. Light, simple rules keep them available without wasting effort.
Can I use it for suppliers or customers?
Yes. The same value-ranking logic works for any list, such as ranking customers by revenue.
Does it work in Google Sheets?
It does, with minor adjustments to formatting after importing.
Download the Template and Get Started
You cannot control everything equally, and you should not try. ABC analysis points your effort where it pays off most.
Download the ABC Analysis Template and find your vital few items today.