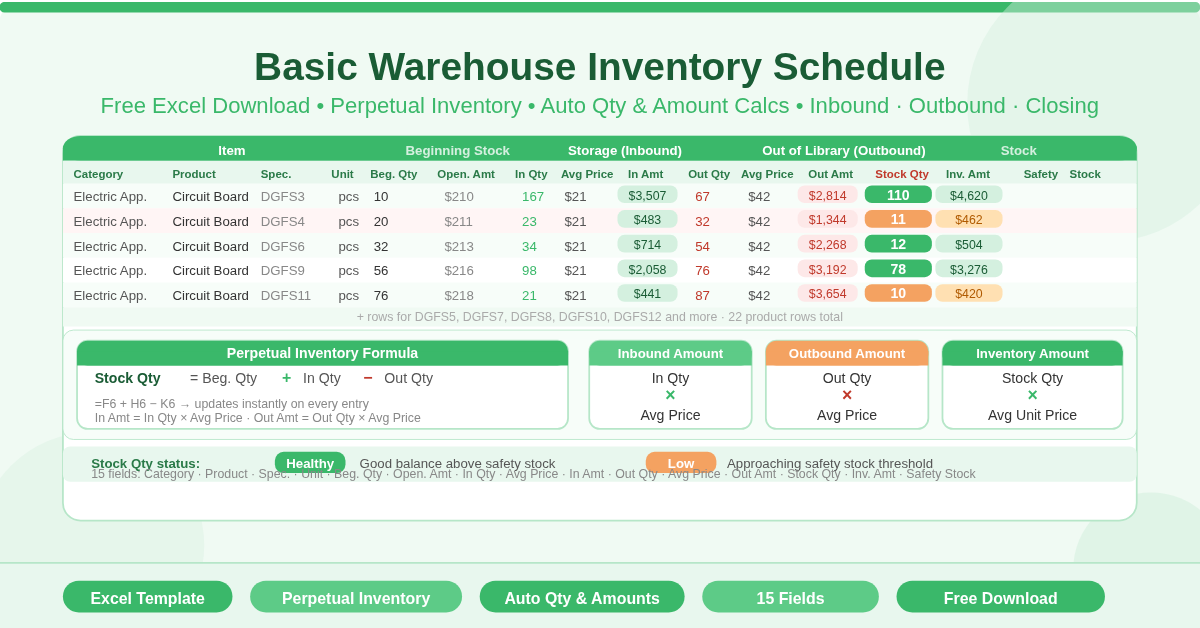
The Basic Warehouse Inventory Schedule Template is a free Microsoft Excel spreadsheet for tracking warehouse stock movements using a perpetual inventory approach. It records opening stock, incoming receipts, and outgoing shipments for each product — and automatically calculates the current stock quantity and monetary inventory value at all times.
The perpetual inventory formula at the heart of every row is:
Stock Quantity = Beginning Quantity + Number of Warehousing − Number Outbound
This means the closing stock quantity always reflects the actual balance after every movement recorded. No manual arithmetic is needed — enter the quantities and prices, and the template does the rest.
What Does the Template Track?
Each product row captures 15 fields organized across five sections:
Item Identification
- Category — the product category (for example, Electric Appliance)
- Product — the product name or type
- Specification — the specific model or variant code
- Unit — the unit of measure
Beginning Stock (Opening Balance)
- Beginning Quantity — the opening stock count at the start of the period
- Opening Amount — the monetary value of the opening stock
Storage (Inbound / Receipts)
- Number of Warehousing — units received into the warehouse
- The Average Unit Price — the average cost per unit for incoming stock
- Inbound Amount — automatically calculated as Number of Warehousing × Average Unit Price
Out of the Library (Outbound / Issues)
- Number Outbound — units dispatched or issued from the warehouse
- The Average Unit Price — the average cost per unit for outgoing stock
- Outbound Amount — automatically calculated as Number Outbound × Average Unit Price
Stock (Closing Balance)
- Stock Quantity — automatically calculated as Beginning Quantity + Number of Warehousing − Number Outbound
- Inventory Amount — automatically calculated as Stock Quantity × Outbound Average Unit Price
- Safety Stock — a reference threshold for minimum stock levels
Every monetary amount field calculates automatically. Enter the quantities and unit prices — the inbound amount, outbound amount, stock quantity, and inventory value all update instantly.
How Does the Perpetual Inventory Calculation Work?
The Stock Quantity formula on every row is:
=Beginning Quantity + Number of Warehousing − Number Outbound
This gives a running balance that reflects all movements in the period. If a circuit board variant has 10 units at the start of the period, receives 167 more, and dispatches 67, the closing stock quantity is 110 units — calculated automatically.
The Inventory Amount then multiplies this closing quantity by the average outbound unit price, giving the monetary value of stock currently held. This is the figure used for balance sheet and period-end reporting.
The template supports 22 product rows out of the box. Each row is fully independent — different categories, specifications, unit prices, and movement volumes can coexist in the same schedule without affecting each other.
Who Should Use This Template?
Warehouse managers running periodic inventory schedules will find the structured column groups — opening, inbound, outbound, closing — map directly to the standard perpetual inventory reporting format.
Manufacturing operations tracking components and raw materials will benefit from the Specification field, which allows multiple variants of the same product (for example, circuit board models DGFS3 through DGFS12) to appear as separate rows with individual movement records.
Stock controllers and inventory accountants preparing period-end valuations will find the automatic Inventory Amount calculation gives them closing stock values without manual computation.
Logistics and distribution teams tracking receipts and dispatches by product category will use the Category and Product columns to organise multi-category inventories in a single schedule.
How to Use the Template
Enter your product details in the Item Identification columns — Category, Product, Specification, and Unit. Fill in the Beginning Quantity and Opening Amount for each product at the start of the period.
As stock is received, enter the Number of Warehousing and the Average Unit Price for that receipt. The Inbound Amount calculates automatically.
As stock is dispatched, enter the Number Outbound and the Average Unit Price for that issue. The Outbound Amount calculates automatically.
The Stock Quantity and Inventory Amount columns update instantly. Review these at any time to see the current balance and value for every product in the schedule.
Use the Safety Stock column to record the minimum stock level for each product. Compare this against the Stock Quantity column to identify any items approaching their safety stock threshold.
How to Modify the Template
Add more product rows by inserting new rows within the existing table. Copy the formulas from an existing row into the Inbound Amount, Outbound Amount, Stock Quantity, and Inventory Amount columns.
Add a Variance column that compares Stock Quantity against Safety Stock — for example, flagging items where Stock Quantity is less than Safety Stock. This turns the schedule into a reorder trigger tool.
Add a Supplier column to link each product to its source. This makes the schedule useful for procurement planning as well as inventory control.
For multi-period tracking, save a copy of the sheet for each period. Use the closing Stock Quantity from one period as the Beginning Quantity for the next.
Conclusion
The Basic Warehouse Inventory Schedule Template gives warehouses and stockrooms a clear, automatic perpetual inventory tracker in Excel. Beginning stock, inbound receipts, outbound movements, and closing balances — all calculated automatically with monetary values throughout. Download it, enter your products and movements, and maintain a current, accurate inventory record every day.