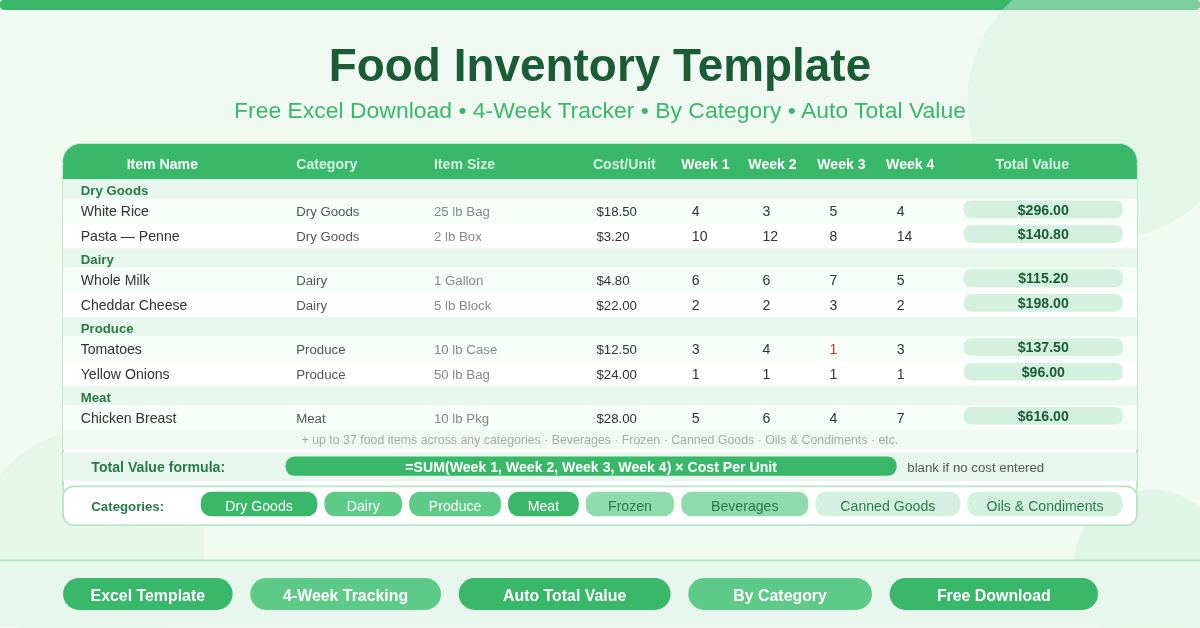
The Food Inventory Template is a free Microsoft Excel spreadsheet for tracking food stock across a four-week period. It records every food item with its category, size description, unit cost, weekly quantity counts, and an automatically calculated total value.
The template suits any setting that needs regular food stock monitoring — commercial kitchens, restaurants, catering operations, food retail businesses, and households managing a monthly food budget. Up to 37 food items can be tracked in a single sheet, with each item’s total value calculating automatically from the weekly counts and cost per unit entered.
What Does the Template Track?
Nine columns capture the complete picture for every food item:
- Item Name — the name of the food item (for example, Rice, Olive Oil, or Canned Tomatoes)
- Category — the food category (Dry Goods, Dairy, Produce, Meat, Frozen, Beverages, etc.)
- Item Size — a description of the unit size and format (Bag, Box, Lb, Oz, Can, Bottle, etc.)
- Cost Per Unit — the price per unit of the item
- Week 1 — quantity on hand or consumed in week one
- Week 2 — quantity for week two
- Week 3 — quantity for week three
- Week 4 — quantity for week four
- Total Value — automatically calculated as the sum of all four weekly quantities multiplied by the cost per unit
The Total Value formula on every row is:
=IF(Cost Per Unit = “”, “”, SUM(Week1, Week2, Week3, Week4) × Cost Per Unit)
If no cost per unit is entered, the Total Value field stays blank rather than showing a zero. Once a cost is entered, the total value appears instantly and updates whenever any weekly quantity changes.
How Can the Weekly Columns Be Used?
The four weekly columns are flexible. Different operations use them in different ways depending on their workflow.
- For stock-take tracking, each week column holds the physical count for that week. Comparing counts week by week reveals consumption trends — which items deplete fastest, which have slow turnover, and which need restocking before the following week.
- For consumption tracking, each week column records how much of each item was used that week rather than how much remains. The Total Value then represents the total cost of each item consumed over the four-week period.
- For ordering planning, the weekly columns can hold order quantities. Total Value then shows the total spend on each item across four ordering cycles.
Any approach works. The template is flexible enough to support all three. Choose the interpretation that fits the operation and apply it consistently.
Who Should Use This Template?
Restaurant and café managers conducting weekly stock takes will use the four columns to track inventory levels over a full calendar month. Comparing stock counts across weeks highlights consumption patterns and prevents unexpected shortages.
Catering businesses managing event-specific food supplies can use one copy per event or month. Entering quantities for each supply week gives a complete picture of food spend against unit costs.
Household budget managers tracking monthly grocery spending will find the weekly structure maps naturally to four shopping trips per month. Entering quantities purchased each week and the cost per unit gives an accurate monthly food spend for every category.
Food retail businesses conducting periodic stock audits can use the template to track on-hand quantities across four audit periods. The Total Value column gives an instant valuation of stock held for each item.
School and community kitchen coordinators managing food supplies for recurring weekly programmes will find the four-week structure ideal for planning and accountability.
How to Use the Template
Start at the top of the sheet and work down the rows. For each food item, enter the Item Name in column B. Add the Category in column C — this makes filtering and sorting by food type easy later. Enter the size description in the Item Size column — for example, “5 lb bag” or “24 oz can” — to make quantities unambiguous.
Enter the Cost Per Unit for the item. This is the price you pay per unit in whatever size you specified. As soon as a cost is entered, the Total Value formula activates for that row.
Fill in the weekly quantity columns as stock takes or usage records are completed. Update Week 1 first, then add Week 2, 3, and 4 figures as the month progresses. The Total Value updates automatically after every entry.
How to Modify the Template
Add a Total Quantity column between Week 4 and Total Value using =SUM(Week1:Week4). This shows total units tracked alongside total monetary value.
Add a Running Total row at the bottom using =SUM(J4:J40) to see the total food inventory value across all items. This is immediately useful for budget reporting.
Apply conditional formatting to the weekly columns to highlight cells below a minimum threshold. This gives a visual low-stock alert for any item that falls under its reorder quantity.
Conclusion
The Food Inventory Template gives restaurants, kitchens, catering businesses, and households a clean, flexible food stock tracker in Excel. Nine fields per item, four weekly quantity columns, and automatic total value calculation across up to 37 items. Download it, enter your food items, and start tracking stock and spending with clarity every week.