The Inventory Management Gantt Chart Template is a free Microsoft Excel workbook for planning and tracking the progress of an inventory management project. It provides a structured task list with lead assignments, completion percentages, and progress status — alongside a built-in horizontal bar chart that visualises completion across all tasks simultaneously.
This template is built for the planning and implementation phase of an inventory management programme. It covers the five core tasks that typically begin any inventory improvement initiative — from assembling the team through to developing the action plan — and gives project leaders a clean, visual progress overview at every stage.
What Does the Template Track?
Four columns capture the key information for each task:
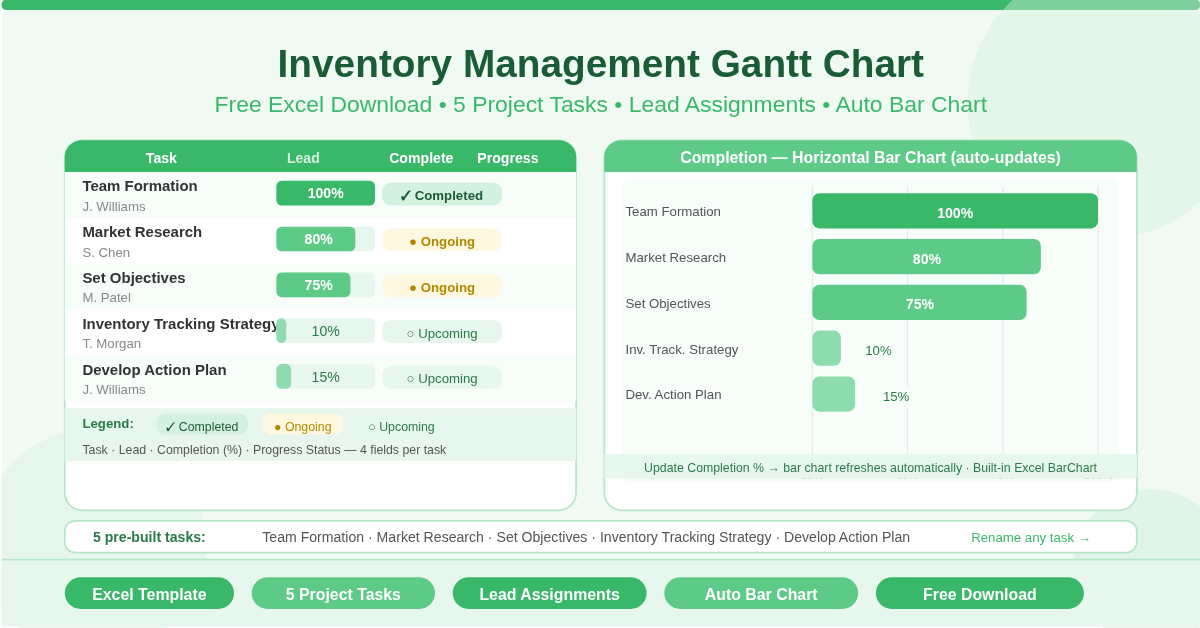
- Task — the name of the project task or milestone
- Lead — the person responsible for completing the task
- Completion — the percentage of the task completed, expressed as a decimal (0 to 1, representing 0% to 100%)
- Progress — the current status of the task: Completed, Ongoing, or Upcoming
A legend at the bottom of the sheet maps the three status labels to their visual meaning, making it easy for any team member to read the tracker at a glance.
What Are the Five Tasks?
The template comes pre-loaded with the five foundational tasks of any inventory management project:
Team Formation — Assembling the right team is the first step. This task covers identifying and onboarding the people who will own and execute the inventory programme. In the sample data this task is shown as 100% complete with a status of Completed.
Market Research — Understanding the external landscape — supplier options, technology tools, industry benchmarks — informs every decision that follows. The sample shows this at 80% completion with a status of Ongoing.
Set Objectives — Defining clear, measurable goals for the inventory programme gives the team direction and success criteria. Shown at 75% in the sample, also Ongoing.
Inventory Tracking Strategy — Deciding how inventory will be tracked — what system, what frequency, what metrics — is the core strategic output of the project. Shown at 10% and marked as Upcoming.
Develop Action Plan — Translating strategy into a detailed implementation plan with owners, timelines, and milestones. Shown at 15% and also Upcoming.
These five tasks are a starting framework. Each can be renamed, split, or expanded to match the specific inventory project being managed.
How Does the Built-In Bar Chart Work?
The horizontal bar chart is embedded directly in the sheet and draws its data from the Task and Completion columns automatically. Every time a completion percentage is updated in the data table, the chart refreshes to show the new value.
The chart displays each task as a horizontal bar, with bar length proportional to completion percentage. A task at 100% fills the full bar width. A task at 10% shows a short bar at the left. This visual format makes it immediately obvious which tasks are well advanced and which are still in early stages.
No chart editing is needed. Update the Completion column and the chart does the rest.
Who Should Use This Template?
Inventory project managers leading a formal inventory system review or implementation will use this template to communicate progress to stakeholders. The chart provides a clear one-page summary that anyone can read without explanation.
Operations teams beginning an inventory improvement initiative will find the five pre-built tasks provide a solid starting point. Rather than building a project structure from scratch, the template gives a proven framework that can be adapted quickly.
Small business owners managing their first structured inventory project will appreciate the simplicity. Four columns, five tasks, one chart — the entire project lifecycle visible in one sheet.
Consultants and advisors working with client organisations on inventory programmes can use the template as a deliverable. It communicates scope, accountability, and progress clearly in a format clients can update themselves.
How to Use the Template
Open the sheet and start with the Lead column. Enter the name of the person responsible for each task in place of the [Insert Name] placeholder.
As work progresses, update the Completion column for each task. Enter values as decimals — 0.25 for 25%, 0.5 for 50%, 1 for 100%. The bar chart updates automatically.
Update the Progress column to reflect the current state — Completed, Ongoing, or Upcoming. This status label gives quick context alongside the percentage figure.
Review the chart section to see the visual summary. Share the sheet with stakeholders to communicate project status without needing a separate report.
How to Modify the Template
Rename any of the five tasks to match your specific project. Click on the task name cell and type the new name. The chart label updates automatically.
Add more tasks by inserting new rows within the data table above row 16. Extend the chart data range to include the new rows by editing the chart’s data source.
Add a Start Date and End Date column to transform the template into a fuller Gantt chart. With dates defined, each task can be plotted on a timeline rather than just by completion percentage.
Add a Comments or Blockers column to capture notes alongside each task. This turns the simple tracker into a working project management document.
Conclusion
The Inventory Management Gantt Chart Template gives any team a clean, visual project tracker for inventory initiatives. Five pre-built tasks, lead assignments, completion percentages, status labels, and an auto-updating horizontal bar chart — all in one free Excel sheet. Download it, assign your leads, and track your inventory project from kickoff to completion.