A stockout rarely arrives without warning, yet the warning is easy to miss in a long list of numbers. By the time you notice, the sale is gone.
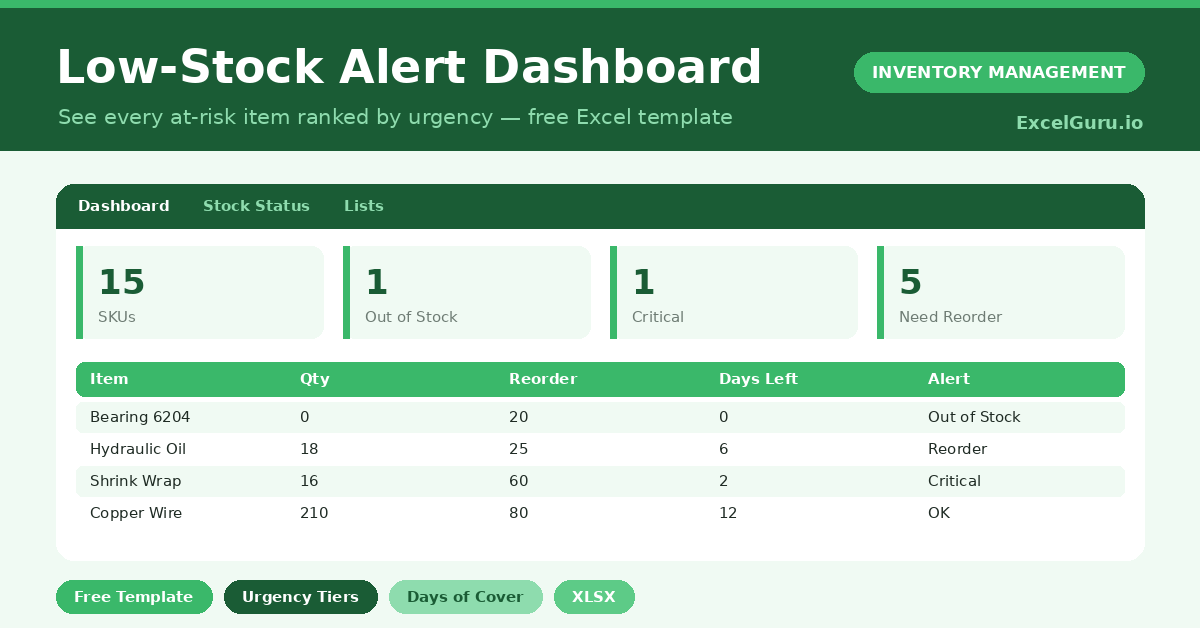
This free low-stock alert dashboard surfaces the warning early. It ranks every at-risk item by urgency and estimates how many days of stock remain. You will also find realistic sample data already inside the file. Therefore, you can explore every formula, dropdown and chart first, and then replace the samples with your own records in minutes.
Below, we explain the alert tiers, the formulas, and how to adapt the dashboard to your own products.
What Is a Low-Stock Alert Dashboard?
A low-stock alert dashboard turns a plain stock list into a board of warnings. Each item gets an urgency level based on its quantity and usage.
It also estimates the days of stock left from average daily use. As a result, you see not just what is low, but what will run out first.
Why Do Stock Alerts Matter?
Stockouts cost more than a single lost sale. They send customers to competitors and force expensive rush orders to recover.
Early alerts prevent both outcomes. Therefore, you can reorder calmly and on your own terms instead of firefighting. The days-of-stock estimate also tells you which shortage is truly urgent.
Why Use This Template?
A clear alert board prevents costly surprises. In particular, this one helps you:
- See out-of-stock and critical items instantly.
- Rank shortages by days of stock remaining.
- Calculate the shortfall to your reorder level.
- Sort urgency into clear, colored tiers.
- Decide which order to place first.
What’s Inside the Template?
The workbook has four tabs:
- How to Use — a built-in guide.
- Dashboard — alert counts and the lowest days of cover.
- Stock Status — the working sheet, one row per item.
- Lists — the category dropdown.
What Formulas Does the Template Use?
The dashboard uses dependable Excel formulas:
| Formula | What it does |
| =Qty on Hand / Avg Daily Usage | Estimates the days of stock left. |
| =IF(Qty<=Min,”Critical”,…) | Sets the alert tier from the levels. |
| =IF(Qty<Reorder, Reorder-Qty, 0) | Calculates the shortfall to reorder. |
| =COUNTIF(Alert,”Critical”) | Counts the critical items. |
| =AVERAGEIF(Days,”>0″) | Calculates the average days of cover. |
How Do You Use the Template?
Setup is quick. Just follow these steps:
- Open the Stock Status tab and list your items.
- Enter the quantity on hand and the reorder level.
- Set a minimum level as your true safety floor.
- Add the average daily usage for each item.
- Let days of stock, alert tier and shortfall calculate.
- Work the Dashboard from the most urgent item down.
What Are the Best Use Cases?
The dashboard fits many businesses, such as:
- Retailers protecting bestseller availability.
- Cafes and kitchens watching fast-moving stock.
- Workshops keeping critical spares on hand.
- E-commerce sellers avoiding oversold listings.
- Any team that cannot afford a stockout.
How Can You Modify the Template?
You can adapt it easily. To change the tiers, edit the thresholds in the Alert Level formula to match your risk appetite.
You can also add a supplier or lead-time column to plan the reorder itself.
Moreover, the sheet covers 40 items by default, and you can copy the formulas down for more.
What Mistakes Should You Avoid?
A few habits weaken the alerts. Therefore, avoid these common mistakes:
- Leaving average usage blank, which hides the days of cover.
- Setting the minimum level to zero, which disables Critical.
- Reacting to color alone and ignoring days left.
- Updating quantities too rarely to trust the board.
Tips to Get the Most From It
- Base average usage on recent, real sales.
- Set the minimum level from your supplier lead time.
- Clear red alerts before amber ones.
- Check the dashboard daily for fast-moving items.
Frequently Asked Questions
What does days of stock left mean?
It is the quantity on hand divided by average daily usage. Therefore, it estimates how long current stock will last at the normal rate of use.
What is the difference between reorder level and minimum level?
The reorder level triggers a normal order. The minimum level is a lower safety floor; falling below it marks an item Critical.
How are the alert tiers decided?
The template compares quantity against your minimum and reorder levels. It then assigns Out, Critical, Reorder, Watch or OK from highest urgency down.
Can it tell me how much to order?
It shows the shortfall to your reorder level as a starting point. You can add a target or maximum level to size the full order.
Does it work in Google Sheets?
It does, with minor adjustments to formatting after importing.
Download the Template and Get Started
A stockout is a self-inflicted wound, and this dashboard helps you avoid it. It shows what is at risk and what to fix first.
Download the Low-Stock Alert Dashboard and stop running out today.