
A blood sugar log gives you and your healthcare team a clear, organised record of your readings over time. A single reading on a meter tells you little on its own, but a pattern across days and weeks tells a story. So writing each reading down, with its time and context, turns scattered numbers into something genuinely useful for your care.
This free printable template records each reading alongside its context, such as fasting or after a meal. So it shows your averages and trends over time. As a result, you have a calm, well-organised record to bring to your appointments.
This is a personal log to help you keep a clear record and have a better conversation with your healthcare team. It is NOT medical advice, a diagnosis, or a guide to treatment, diet or medication. It sets no targets. For any concerns, symptoms, or decisions about your health, please contact a qualified healthcare professional.
What does the blood sugar log include?
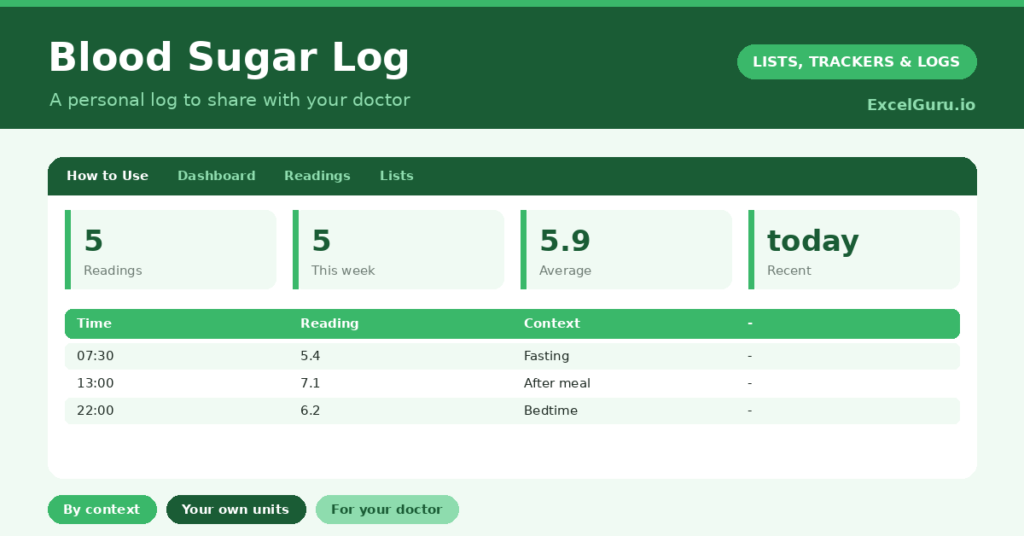
The template is one readings log feeding a gentle dashboard. A dropdown keeps the context tidy. In short, you get the following:
- A readings log with the date, time, your reading, the context and notes.
- A dropdown for context, covering fasting, before and after meals, and bedtime.
- A free-text notes column for anything worth remembering, such as illness or activity.
- Readings recorded in your own units, whatever your meter uses.
- A dashboard showing total readings, this week’s readings, your average, your highest and lowest, and the most recent date.

Which formulas power the blood sugar log?
The dashboard gently summarises your readings without any interpretation. A COUNTA totals your readings, and a SUMPRODUCT counts those from the last week, so you can see how regularly you have been logging.
An AVERAGEIF gives your average reading, while MAX and SMALL show your highest and lowest. So the dashboard offers a simple statistical overview, with no judgement about whether a number is good or bad. Those interpretations belong with your healthcare team, who can read them in the context of your health.
Why keep a blood sugar log?
The first reason is better conversations with your doctor. A clear, dated record of readings and their context is far more useful than a few numbers recalled from memory. So your healthcare team has solid information to work with.
The second reason is seeing patterns over time. The context column lets you compare fasting readings with after-meal ones, which can reveal how your readings move through the day. So you and your team have something concrete to discuss. Keeping the record in one place is simply convenient, too. In short, the log supports a calmer, better-informed partnership with your healthcare team.
What does the dashboard reveal?
The dashboard offers a quiet, factual overview rather than any verdict. This week’s readings show how regularly you have logged, and the most-recent date keeps the record current. So you can see your logging at a glance.
The average, highest and lowest figures simply describe the range of your readings over the period. They are there to inform a conversation with your healthcare team, not to be judged on their own. Because the log sets no targets, the dashboard stays purely descriptive. So it remains a gentle record, never a source of alarm.
How do you use it?
Record each reading soon after you take it, entering the time and the context. So the record stays accurate and comparable. Use your own units, whatever your meter displays, and add a note for anything relevant, such as illness or unusual activity.
Then bring the log to your appointments, so your healthcare team can see the full picture. Because the readings build over time, patterns become easier to discuss. The log is simply a clear record; the interpretation always belongs with a professional. In short, a few seconds per reading gives your team a far clearer view.
How do you customize it?
Edit the context options on the Lists tab to match how you monitor. Additionally, you can add columns for what you ate, any activity, or how you felt, if your healthcare team finds that helpful. Some people add a column for medication timing, on professional advice. The template adapts to occasional checks or more frequent monitoring, as guided by your team.
What mistakes should you avoid?
The first mistake is using the log to make health decisions on your own. It is a record to share, not a basis for changing anything yourself, so always involve a professional. The second mistake is logging readings without their context.
A reading means much more when you know whether it was fasting or after a meal, so always add it. Finally, please do not let the numbers become a source of anxiety. If logging ever feels distressing, it is completely fine to step back, and to reach out to your healthcare team or someone you trust for support.
Frequently asked questions
Is the blood sugar log medical advice?
No. It is simply a personal record to help you keep clear data and share it with your healthcare team. It sets no targets and offers no advice. All interpretation and decisions belong with a qualified professional.
What units should I use?
Use whatever units your meter displays, and stay consistent. The log and its averages work the same way regardless, since it simply records the numbers you enter.
How does it help my doctor?
It gives them a dated record of your readings and their context, which is far more useful than numbers recalled from memory. That helps them see patterns and discuss your care with you.
Record each reading with its time and context, and bring the log to your appointments. A blood sugar log cannot interpret your readings or replace professional care, but it gives you and your healthcare team a clear, organised record to work from, which makes every conversation about your health more informed.