
A good sales lead tracker answers three questions fast: which deals are live, what are they worth, and who do I chase today. Most small teams do not need a heavy CRM to do that. They simply need a clear pipeline they actually keep updated.
This free template turns Excel into a lightweight CRM. So you move every lead from *New* through to *Won* or *Lost*, and the sheet forecasts your revenue as you go. Best of all, there is no subscription and nothing new to learn. You open the file and start selling. Moreover, because it is just a spreadsheet, you can email it, share it on a drive, or keep it entirely private. The choice stays yours.
What does the sales lead tracker include?
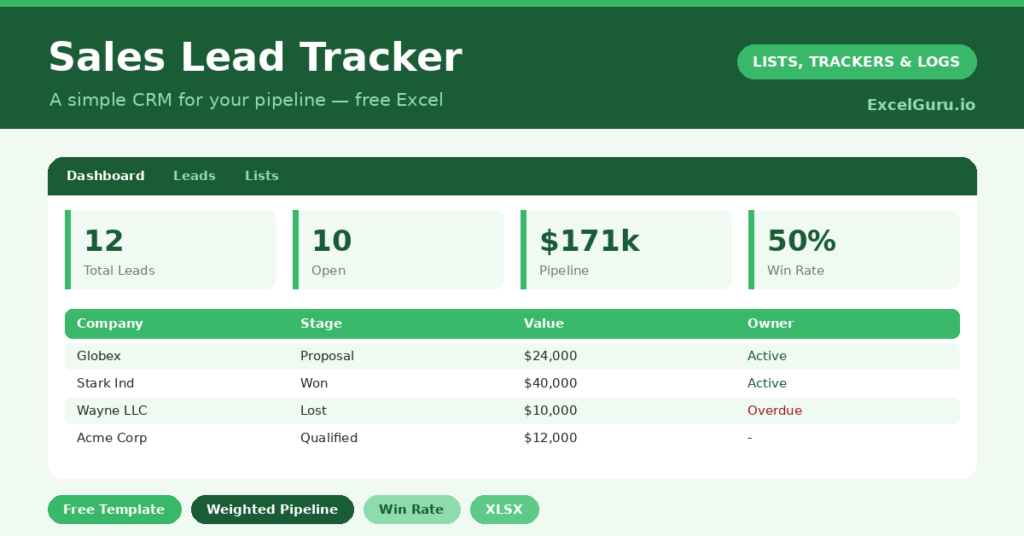
The template is built around one pipeline sheet and a forecasting dashboard. Each lead is a single row. Dropdowns keep your stages, sources and owners consistent, so the data never turns to mush. In short, you get everything below:
- A leads table with company, contact, source, stage, deal value, probability and weighted value.
- A next action and a follow-up date for every lead, with an automatic day countdown.
- Color-coded stages, so won, lost and in-progress deals stand out at a glance.
- A dashboard showing open leads, raw and weighted pipeline, win rate, and a breakdown by stage and source.
Because every lead is structured data, you can sort the whole pipeline by value or by follow-up date in one click. Therefore the lead that needs you today never hides at the bottom of the list.
Which formulas power the sales lead tracker?
The clever work happens quietly in the background. Raw pipeline value flatters you, because it treats a long shot exactly like a near-certain deal. Weighted value fixes that problem at a stroke.
The tracker calculates it with =Value * Probability. So a $20,000 deal at 50% counts as $10,000 of likely revenue. The dashboard then sums weighted value across open deals only, using SUMIFS to exclude anything already won or lost. Meanwhile, your win rate is simply =Won / (Won + Lost). As a result, you get an honest forecast instead of a hopeful one.
What does the dashboard reveal?
The dashboard is where strategy replaces guesswork. At a glance, you see how many leads are genuinely open, not just how many exist. You also see two pipeline figures side by side: the raw total and the weighted forecast.
That gap between them is instructive. A large raw number with a small weighted one means your pipeline is full of low-probability hope. The stage breakdown then shows where deals cluster. For instance, a pile-up at *Proposal* suggests you are good at interest but slow at closing. So the chart points you straight at the bottleneck.
Why use a spreadsheet CRM?
For a solo founder or a small sales team, a spreadsheet is often the right tool. First, you own the data outright. Second, you can reshape it however you like. Third, there is nothing to set up beyond opening the file.
The follow-up countdown matters most of all. Leads go cold when nobody follows up, and that is the most expensive mistake in sales. Because this sheet flags every overdue follow-up, those leads stop slipping away. Later, as your team grows, you can graduate to a full CRM. Until then, a tracker like this carries you a long way.
How do you customize it?
Open the Lists tab to edit the stages, sources and owners. For example, you might add a *Demo Booked* stage or a *Partner* source. Furthermore, you can add a column for the expected close date and forecast by month. A notes field helps too, since the context behind a deal is easy to forget. Then sort by follow-up days, and your day plans itself.
What mistakes should you avoid?
The first mistake is inflating probabilities to make the forecast look healthy. Be honest, or the weighted number means nothing. The second mistake is letting follow-up dates lapse, because a pipeline you do not work is just a list of names.
Finally, mark dead deals as *Lost* rather than deleting them. Your win rate depends on knowing how many you did not close. Delete the losses and you flatter yourself into bad decisions. In short, honest data beats pretty data every time.
Frequently asked questions
Is this sales lead tracker a full CRM replacement?
For small teams and solo sellers, often yes. It tracks pipeline, value and follow-ups well, and it costs nothing. Very large teams that need shared real-time access may eventually move to a dedicated CRM, but many businesses run happily on a sheet like this for years.
How is weighted pipeline calculated?
Each lead’s weighted value is its deal value multiplied by its probability. The dashboard then sums weighted value across open deals, which gives you a realistic revenue forecast rather than a best-case guess that never quite arrives.
Can I track which salesperson owns each lead?
Yes. Assign an owner to every lead from the dropdown. Then filter by owner to review one person’s pipeline, compare performance, or run a focused one-on-one with real numbers in front of you.
Set it up in ten minutes, keep it current as deals move, and you will always have a clear answer to the questions that matter: what is live, what is it worth, and who do I call next.