Your agile team finishes week two of the sprint. The board shows three completed tasks, but you have no idea if that matches the original plan. Did you finish them on time? Are you ahead or behind? Without a burndown chart, these questions stay unanswered until the sprint review – when it is already too late to adjust.
The sprint burndown chart template solves this by comparing your baseline (planned) completion against actual completion week by week. You list each feature, then mark which week you planned to finish it and which week you actually finished it. The template calculates remaining work for both baseline and actual scenarios. A built‑in commentary explains what the numbers mean.
Checkout Online Burndown Chart Generator.
What Is the Sprint Burndown Chart Template?
This template is a dedicated Excel workbook for agile sprint tracking. It serves Scrum masters, product owners, development teams, and project managers who need to visualize progress within a single sprint.
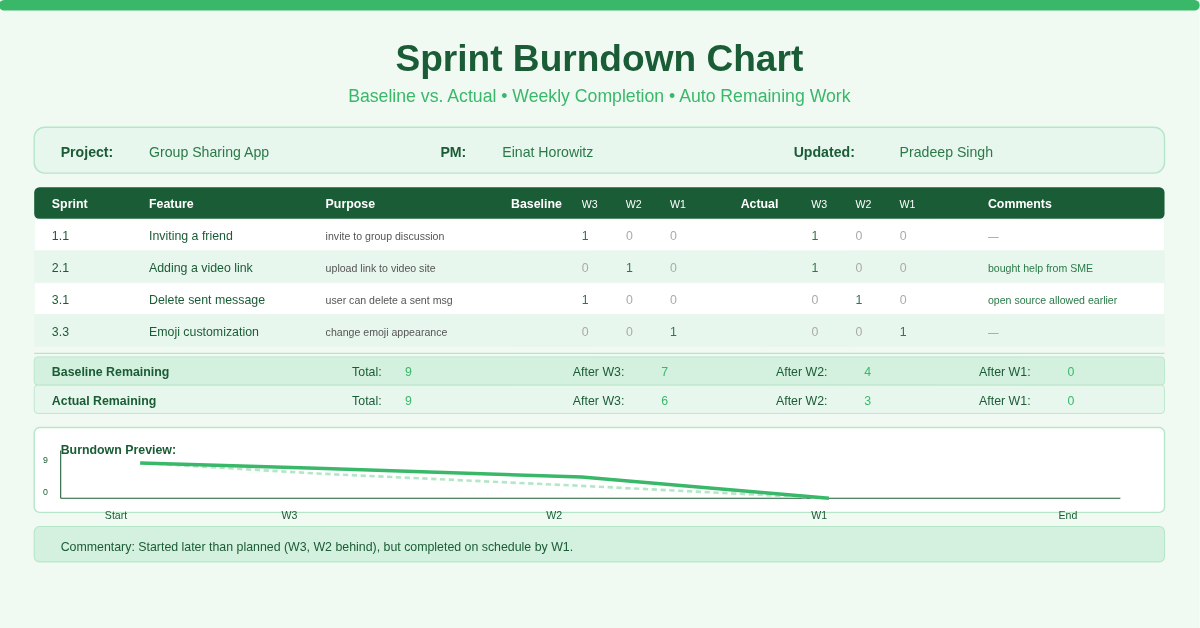
The template contains one sheet with six clear sections:
- Project header – Project name, manager, update date, and updater name.
- Feature table – Sprint numbers, feature descriptions, purpose notes, and columns for marking planned (baseline) and actual completion weeks.
- Baseline Sprint Completion – Three week columns where you mark “1” if the feature was planned to finish that week.
- Actual Sprint Completion – Three week columns where you mark “1” if the feature actually finished that week.
- Comments column – Free text for explaining variances (e.g., “feature proved harder than anticipated” or “open source allowed earlier completion”).
- Calculated remaining rows – Aggregate remaining points for baseline and actual, using SUM and cumulative subtraction formulas.
The template supports three weeks per sprint. Each feature can only be marked as completed in one week per scenario (baseline and actual).
Feature‑Level Planning and Tracking
The template lists every feature with its own row. Columns include:
- Sprints (e.g., 1.1, 1.2, 2.1, 3.1) – Groups features by sprint number.
- Feature – Name of the user story or task.
- Purpose – Brief explanation of why the feature matters.
Under Baseline Sprint Completion (columns E, F, G for Week #3, Week #2, Week #1), you place a “1” in the week you plan to complete that feature. Under Actual Sprint Completion (columns H, I, J for Week #3, Week #2, Week #1), you place a “1” in the week the feature actually completed.
For example, “Inviting a friend” has a baseline 1 in Week #3 and an actual 1 in Week #3 – on schedule. “Adding a video link” has a baseline 1 in Week #2, but the actual 1 appears in Week #1 – completed earlier than planned, thanks to external help (noted in Comments). “Deleting a sent message” shows the opposite: baseline Week #3 but actual Week #2 – completed earlier using open source code.
This granularity allows you to see not just if a feature finished, but whether it finished on the planned week, earlier, or later.
Automatic Remaining Work Calculation (Burndown)
Below the feature table, the template calculates remaining work using simple SUM formulas.
Baseline Sprint Completion (row 15)
Cell E15: =SUM($E$5:$G$13) – total planned feature count across all three weeks (e.g., 10 features).
Cell F15: =SUM($E$5:$G$13)-SUM(E5:E13) – remaining work after Week #3 (subtracts those marked “1” in Week #3 column).
Cell G15: =SUM($E$5:$G$13)-SUM(E5:F13) – remaining work after Week #3 and Week #2.
Cell H15: =SUM($E$5:$G$13)-SUM(E5:G13) – remaining work after all three weeks (should be zero if all features planned).
Actual Sprint Completion (row 16)
Cell H16: =SUM($H$5:$J$13) – total actual feature count.
Cell I16: =SUM($H$5:$J$13)-SUM(H5:H13) – remaining actual work after Week #3.
Cell J16: =SUM($H$5:$J$13)-SUM(H5:I13) – after Week #3 and Week #2.
Cell K16: =SUM($H$5:$J$13)-SUM(H5:J13) – after all three weeks.
These numbers create the classic burndown line. Plot Baseline Remaining (row 15, columns F→G→H) against Actual Remaining (row 16, columns I→J→K) on a line chart. The gap between the two lines tells you immediately if you are ahead or behind.
Comments That Explain Variance
The template includes a Comments column (column K) where you annotate any deviation between baseline and actual.
In the example:
- “Adding a video link” – “This feature proved to be harder than anticipated, and required buying help from an SME.” (Feature finished earlier despite difficulty because of external help.)
- “Deleting a sent message” – “Open source allowed to complete earlier than planned.”
- “Statistics on sent messages” – no comment, completed as planned.
The Commentary row at the bottom synthesizes these notes into a single narrative: “The sprints started off later than planned (1 sprint later than planned for week #3 and week #2), but on the third and final week the team was able to complete on schedule.”
This commentary turns raw numbers into a story you can share with stakeholders. You can edit it directly in the template.
How Do the Cumulative Subtraction Formulas Work?
The template uses a clever pattern for cumulative remaining work. Take the baseline after Week #2 (cell G15):
=SUM($E$5:$G$13)-SUM(E5:F13)
- SUM($E$5:$G$13) = total planned completions across all weeks (e.g., 10).
- SUM(E5:F13) = sum of all “1” marks in Week #3 column (E) and Week #2 column (F). This counts every feature planned for Week #3 or Week #2.
- Subtract: remaining work = features that were planned for Week #1 only – because those are not yet subtracted.
Similarly, after Week #1 (cell H15): subtracts all three week columns, leaving zero.
Because the formula uses mixed references (E5:F13 expands as you copy it to the right), it automatically adjusts which columns are included in the subtraction. Therefore, you do not need to edit formulas when you add or remove rows – as long as you keep the total range absolute ($E$5:$G$13).
Practical Use Cases
Scrum Master for a Software Team – Use the template for each two‑week sprint. Before the sprint, fill baseline week assignments. During the sprint, update actual week assignments daily. The remaining work rows show whether you need to reprioritize or escalate blockers.
Product Owner Managing Feature Delivery – Share the completed burndown chart in sprint review. The commentary gives you a script: “We started week 3 a full week behind plan, but caught up by week 1 due to the open source solution for message deletion.”
Agile Coach Training New Teams – Use the sample data (inviting a friend, liking a post, etc.) to teach burndown mechanics. The pre‑filled comments show real‑world examples of variance explanations.
Project Manager in Non‑Software Context – Adapt the template for any project with three phases. Replace “feature” with deliverables (e.g., “Design wireframes”, “Write copy”, “Build prototype”). Mark planned and actual weeks the same way.
Student Learning Agile Metrics – Study the example to understand how baseline vs. actual burndown works. The formulas are simple SUM and subtraction – no complex statistics. The commentary row shows you how to interpret the numbers.
How to Set Up and Start Using the Template
Follow these steps to run your own sprint burndown:
- Download the Excel file from the link below. Open the Sprint sheet.
- Replace the sample Project Manager, Project, Update Date, and Updated By with your details.
- In rows 5–13 (the feature table), list your sprint numbers (e.g., “1.1”, “1.2”, “2.1”) and feature names. Write a brief purpose for each.
- For Baseline (Week #3, Week #2, Week #1): decide which week you plan to complete each feature. Put a “1” in only one of the three baseline week cells per row.
- As the sprint progresses, move to Actual (Week #3, Week #2, Week #1). When a feature completes, put a “1” in the actual week cell that matches the real completion week.
- Use the Comments column to explain any mismatch between baseline and actual.
- Watch rows 15 and 16 automatically update remaining work numbers.
- Create a line chart:
- Select row 15 cells F15, G15, H15 (baseline remaining after each week).
- Hold Ctrl and select row 16 cells I16, J16, K16 (actual remaining after each week).
- Insert → Line Chart.
- Edit the Commentary row (row 33) to summarize the sprint’s story.
The template works for sprints of three weeks. If your sprint is two weeks, leave the third week columns blank. If longer, duplicate the week columns and adjust the SUM ranges accordingly.
Download Your Free Sprint Burndown Chart Template
Stop guessing whether you are on track. Start visualizing baseline vs. actual progress every week. Download the free sprint burndown chart template below. It works with Excel 2016, 2019, 365, and Google Sheets (with minor adjustments for array formulas). The auto‑calculating remaining work and commentary row are ready to use.